


ABSTRACT
OBJECTIVE To compare rates of mammography screening among women in family practices, based on a sequential sample of eligible women presenting to the practices during an 8-week period, with rates found in a full audit of all eligible patients.
DESIGN Chart review.
SETTING Twenty community-based family practices in south-central Ontario.
PARTICIPANTS Family physicians and their female patients 52 to 71 years old who had had at least 1 visit to the office during the past 3 years.
INTERVENTION Eligible patients were sampled by 2 approaches: sequential sampling of patients coming for appointments during an 8-week period and a full practice audit of all eligible women.
MAIN OUTCOME MEASURE Mammography rates found using the 2 approaches.
RESULTS The mean time-appropriate rate of mammography screening based on the sequential sample was 66.4%. The mean time-appropriate rate of mammography screening for the full practice audit was 58.8%. The sequential sample rate was higher than that of the full audit by 7.6%; differences ranged from −6.5% to 24.9% among practices. Regression analysis indicated a positive and significant correlation between rates based on the data generated by the 2 different approaches (r2 = 0.50).
CONCLUSION A rate of mammography screening based on a sequential sample can reasonably approximate the actual rate of mammography screening that would be found based on a full practice audit.
Quality assurance activities in family medicine are recommended by the College of Family Physicians of Canada.1 Quality assurance involves reviewing and reflecting on the way we practice and trying to improve it. Several authors have studied various ways to measure family physicians’ performance of selected preventive maneuvers and to provide feedback to improve the quality of care.2,3 There are at least 2 recurring problems that deter implementation of quality assurance in family practices: getting physicians involved in the quality assurance activities and the amount of time and energy it takes to perform data extraction.2 This last is particularly a factor for practices that do not use fully electronic medical records.
In an attempt to make data extraction easier and less time-consuming, 20 physicians participated in an audit of mammography screening rates in family practice using an approach designed to overcome these problems. Instead of conducting a full practice audit or an audit based on a random sample of patients representative of the practice, a sample was generated from consecutive eligible patients who were booked for appointments during a predefined data-collection period.4 As these women’s charts were already pulled for the appointments, the relevant information was easily available and was collected by the physicians or their office staff.
Once collected, the data were faxed to a research assistant who collated them weekly. Anonymous individual and group summaries were prepared and shared with all participants weekly.
This very inexpensive process stimulated an enthusiastic response from participants as they collected their own data and compared them with the data of their peers. Before further studies of the effect of using a sequential sampling technique to collect data for an audit were to be undertaken, it was thought important to assess how well the data generated using this approach represented data from the whole practice. This paper reports on a study in which the results of an audit of mammography screening rates among all women in a practice eligible for screening were compared with the results of an audit of a sample of eligible women from the same practice chosen by a sequential sampling technique.
METHODS
Twenty family physicians in south-central Ontario volunteered to participate in the study. Seventeen of these physicians had been involved in a previous audit that had been part of a faculty development project in the Department of Family Medicine at McMaster University in Hamilton, Ont. The other 3 were colleagues of 1 of the authors (G.S.) who recruited them for the study.
Data were collected using 2 sampling strategies. One approach was based on a full practice audit of all eligible patients in a practice, and the other collected data from a sample of eligible women from the same practice who booked appointments during the 8-week study period. Eligible patients were defined as women 52 to 71 years old who had had at least 1 visit to the office during the past 3 years. The age group chosen corresponded to the recommended age group for screening with 2 years added to allow for the first mammograms to be done within the recommended period (50 to 69 years old).5 All women were included even if mammography was ordered for diagnostic rather than screening purposes.
Each practice was responsible for generating a list of eligible patients for the complete audit. The same research assistant visited each practice and reviewed the charts of all patients on the list. Physicians or office staff were responsible for collecting data from the sequential sample of eligible patients who had appointments during the study period. Data sheets were faxed to the research assistant who entered the data into an Excel spreadsheet. The practices were assessed in 4 blocks of 5 physicians to allow the full and sequential audits to occur simultaneously.
The research assistant collected data on age, date of most recent mammogram, and whether patients had participated in the Ontario Breast Screening Program. Questionnaires were sent to physicians before and after the audit, asking about practice profiles and the effect of the processes of the study on office function. In 1 practice, a second reviewer audited a random sample of the charts of eligible patients to ensure validity of the extraction process.
We hypothesized that there would be a 5% to 10% difference between rates measured by the 2 audit techniques with the sequential approach yielding a higher rate of mammography than the full practice approach.
Data were analyzed using SPSS software for Macintosh (version 9.1). Descriptive statistics were calculated, and correlational analyses were conducted using the difference between the mammography rates based on the 2 sampling strategies as the dependent variable to examine associations with physician and practice variables. All statistical tests were 2-sided and a P value of > .05 was considered statistically significant. Ethics approval was received from the Ethics Review Board of Hamilton Health Sciences.
RESULTS
The audits were carried out between September 2003 and June 2004. Seventeen of the family physicians were affiliated with McMaster University Department of Family Medicine (part-time clinical faculty) as part of a group of community physicians who teach family practice residents in their offices; 3 family physicians were community physicians with no university affiliation (Table 16). Table 2 shows a comparison of the sociodemographic characteristics of eligible patients by sampling method. Mammography rates for each data sampling method are compared in Figure 1. Data were collected by physicians in 10 practices, by nurses in 6 practices, and by other members of staff in 3 practices. The mean time-appropriate mammography rate for the full practice audit was 58.8% and for the sequential sample was 66.4%. The sequential sample approach resulted in a higher rate in all but 4 practices. Data were analyzed at various intervals using a grace period of 6 or 12 months after the time-appropriate 2-year mark. In the full practice audit, the rate of mammography increased to 70.0% during the study, while in the sequential sample, the rate rose to 76.2% by the end of the 12-month grace period.

Mammography rates based on full practice audit and on the sequential sample, by practice
Year of graduation ranged from 1965–1991 (median 1980) in the study and the mean year of graduation was 1982.5 in the NPS; practice sizes in the study ranged from 900–3200 patients, compared with a mean size of 2000 patients in the NPS.
Characteristics of eligible patients by sampling method
Figure 2 shows a scatter diagram as well as the regression equation of full audit versus sequential sampling where the cutoff date was 24 months from date of data collection to date of most recent mammogram. Regression analysis, using ordinary least squares linear regression, indicated a positive and significant correlation between mammography rates using the 2 different sampling techniques (r2 = 0.50). Regression analysis indicated that the rate of mammography in the sequential group could be used as a reasonable approximation of the actual rate of mammography based on the full practice audit by employing the following equation: y (actual mammography rate) = 14% + (sequential rate) × 0.66. For example, for a practice with a mammography rate of 50% based on sequential sampling, the full practice rate would be estimated to be 47% (14% + 50% × 0.66 = 47%) and for a practice with a 65% rate, the full practice rate would be estimated to be 56.9%.
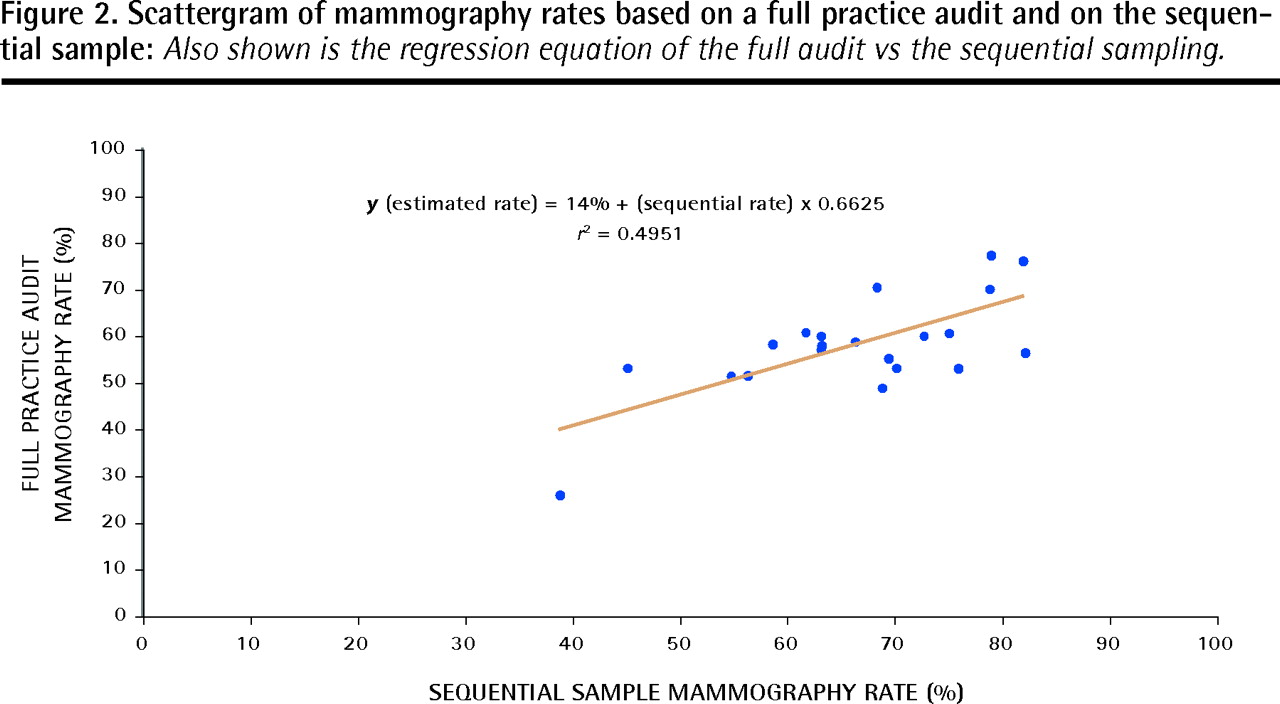
Also shown is the regression equation of the full audit vs the sequential sampling.
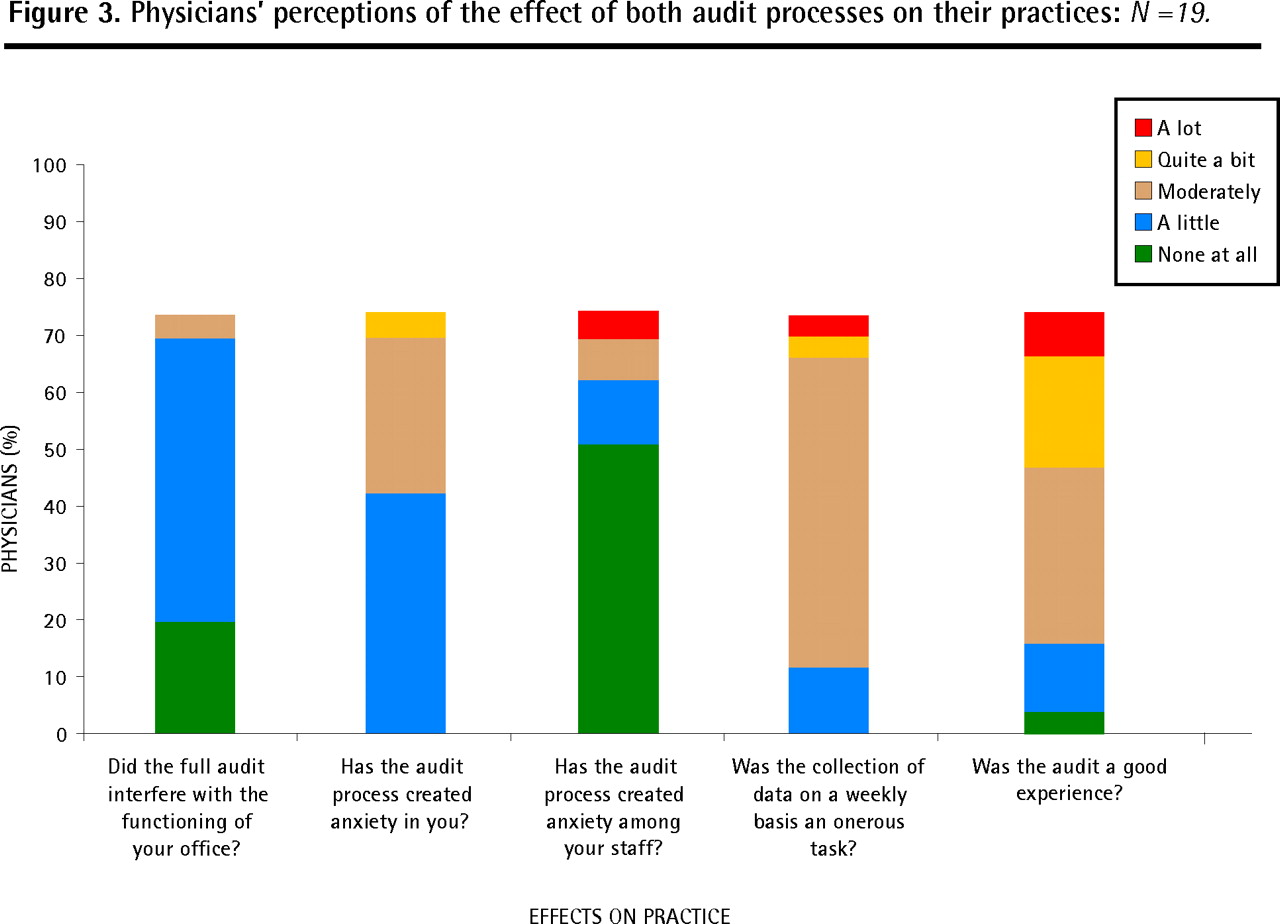
There was no significant difference in mammography rates for women younger than 60 years and women older than 60 years by either sampling technique. Figure 3 summarizes physicians’ perceptions of the effect of the study on their practices.

Physicians’ perceptions of the effect of both audit processes on their practices: N =19.
DISCUSSION
The mean rate of mammography screening was 7.6% higher for the sequential sample than for the full audit. Although the difference in the mean rate was less than 10%, as originally postulated, the amount of variability was greater than expected as was the direction of the difference, which ranged from −6.5% to 24.9%. In 11 practices, mammography rates based on the 2 approaches differed by less than 10%. The anticipated pattern of sequential mammography rates being systematically higher than rates based on a full practice audit was confirmed.
While a rate based on a sequential sample seems to reasonably approximate the actual mammography rate, similar audits need to replicate this study design at other sites and cover other topics to assess its validity and reliability. The fact that the mammography rate based on the sequential sample was higher was anticipated because patients who have office visits are more likely to have more frequent visits and thus are more likely than those who do not have office visits to have mammograms ordered. The regression equation describes a mathematical relationship between mammography rates based on the sequential sample and rates based on a full audit. For physicians who do not have easy access to a full practice audit or who do not have fully computerized medical records, the sequential sampling strategy offers an alternative method of monitoring the care they provide.
Mammography rates based on sequential sampling run the risk of missing women who do not make appointments during the study period. The sequential sampling approach was intended to generate an approximate rate of mammography for a practice, not to find women who had not had time-appropriate mammograms.
In Ontario, incremental financial bonuses are offered as performance incentives to physicians practising under certain new payment models (rostered practices with prescribed rates). The mammography rates we found were similar among practices whether physicians were eligible through rostering for these incentives or not.
Exploratory analysis of factors thought to influence mammography screening rates, such as practice size, age of physician, sex of physician, availability of electronic records, method of payment, and percentage of eligible patients in the practice, did not reveal any notable patterns. One practice identified only 16 eligible patients during the entire study period. This was considerably fewer that the 6 to 10 patients expected to be eligible in each practice each week. As a result, the estimated rate for that practice had a very wide margin of error. The effect of the small numbers was not likely to account for the large difference in rates. Most physicians did not find the sequential audit technique an onerous experience or one that interfered with routine office function. One physician, who did find data collection onerous, had computerized medical records so found a manual data collection process relatively cumbersome. The process generated little anxiety among physicians or their staff, and almost half of them said they were willing to undertake another audit.
Changes in practice and in rates of mammography, while anticipated, were not measured in this study. Some participants commented that it had been a good experience. One said, “I was alerted on how history-keeping on the front of the chart was extremely important,” and another commented, “Recording at our end needed change.” Others said, the audit was “Worthwhile, surprising to me and adjustments gladly made,” and, “[It] provided me with an easy way to be aware of women in my practice needing mammogram.”
Limitations
There are several limitations to this study. In the sequential approach, data collection was self-recorded and, as such, was subject to selection bias. Collection of data by physicians’ staff, although not reported as an onerous task, might have been forgotten some days, thus reducing the number of patients in the sequential sample. Lists for the full audit were generated by the practices, which could also make them subject to selection bias. Without a computerized registry or roster, these lists might not truly represent the full number of eligible patients. These biases could affect estimates of mammography rates in the sequential sampling approach. As patients who have appointments are more likely to have mammograms ordered, sampling such patients is likely to produce a higher rate of mammography. All the physicians were practising in south-central Ontario, and most were affiliated with McMaster University so they are not likely to be representative of Canadian family physicians in general. This chart audit used the presence of a report in the chart as evidence of a mammogram being done. It did not capture mammograms that were ordered but not done. Although a doctor’s endorsement of mammography helps encourage women to have screening, some women prefer not to have mammograms.7,8
Conclusion
A mammography rate based on a sample generated through a sequential approach can create a snapshot of a whole practice for physicians. Having peers collecting similar data creates a credible standard of care against which participating physicians can measure their performance without feeling uncomfortable. Further study needs to be done on other audit topics to see how well rates generated through a sequential approach approximate actual rates that would be found in a full practice audit. Questions about how practice might change after an audit need to be explored with participating physicians.
Acknowledgment
This project was supported by a grant from Physicians’ Services Incorporated.
Notes
EDITOR’S KEY POINTS
-
Quality assurance activities in primary care are important for providing feedback to physicians and improving the quality of care for patients. The amount of time and energy it takes to perform data extraction, however, often deters physicians from participating in such activities. In this study, the authors tested a strategy of sampling consecutive eligible patients, in an attempt to make data extraction easier and less time-consuming, and compared results with those from full practice audits.
-
The authors found a positive and significant correlation between rates based on the data generated by the 2 different approaches. Most physicians did not find the sequential audit technique interfered with routine office function and almost half of them said they would be willing to undertake another audit.
-
Although some physicians in Ontario are eligible to receive performance incentives to encourage increased mammography screening rates, rates were found to be similar among practices whether physicians were receiving performance incentives or not.
POINTS DE REPÈRE DU RÉDACTEUR
-
Dans les soins primaires, les activités de contrôle de la qualité sont importantes pour fournir un feedback au médecin et améliorer la qualité des soins. Toutefois, la quantité de temps et d’énergie nécessaire pour effectuer l’extraction des données décourage souvent le médecin d’entreprendre de telles activités. Dans cette étude, les auteurs ont testé une stratégie d’échantillonnage séquentiel de patientes éligibles, dans l’espoir de rendre l’extraction des données plus facile et plus rapide, et ils ont ensuite comparé les résultats à ceux obtenus avec toutes les clientes d’une clinique.
-
Les auteurs ont trouvé une corrélation positive significative entre les taux calculés à partir des données des 2 approches différentes. La plupart des médecins ont trouvé que la technique d’échantillonnage séquentiel n’interférait pas avec l’activité normale de la clinique et près de la moitié d’entre eux ont dit qu’ils seraient disposés à entreprendre une autre vérification.
-
Même si certains médecins ontariens sont susceptibles de recevoir des incitatifs pour augmenter les taux de dépistage mammographique, les taux étaient les mêmes chez tous les médecins, qu’ils aient reçu ou non de tels incitatifs.
Footnotes
-
Contributors
Dr Swanson, principal investigator and author, had the original idea and developed it with Dr Kaczorowski, co-investigator and statistician. Dr Swanson drafted the article, and Dr Kaczorowski reviewed, revised, and edited it. Both the authors agreed on the version submitted for publication.
-
Competing interests
None declared
-
*Full text is available in English at www.cfp.ca.
-
This article has been peer reviewed.
- Copyright© the College of Family Physicians of Canada
In this issue


Jump to section
Related Articles
Cited By...
- No citing articles found.