


Abstract
Objective To review the evidence for recognition and management of atherogenic dyslipidemia.
Sources of information High-quality randomized trials and meta-analyses were available to address most questions. North American and European guidelines were reviewed. Of these, the Canadian Cardiovascular Society lipid guidelines were most congruent with current literature.
Main message Atherogenic dyslipidemia is characterized by low levels of high-density lipoprotein (HDL), high levels of triglycerides, and a high low-density lipoprotein (LDL) particle number. The condition is highly associated with cardiovascular disease (CVD) and is poorly reflected in Framingham risk score and LDL measurements. Obesity, glucose intolerance, diabetes, and metabolic syndrome are rapidly becoming more common, and are often associated with atherogenic dyslipidemia, affecting long-term CVD risk. Recognition in the office is best achieved by non-HDL or total cholesterol–HDL ratio testing. Treatment success lies in optimizing diet and exercise. Of available medications, statins produce the most benefit and can be titrated to patient tolerance rather than to LDL target levels, which have a poor evidence base. The addition of fenofibrate can be considered in patients with high triglyceride and low HDL levels who have responded poorly to or have not tolerated statins.
Conclusion Growing obesity prevalence creates a CVD risk that might be missed by LDL cholesterol testing alone. Simple calculations from results of a non-fasting lipid panel produce non-HDL levels and total cholesterol–HDL ratio, both of which are superior for predicting risk in all patients. These metrics should be available in lipid panels.
The end of the human race will be that it will eventually die of civilization.
Ralph Waldo Emerson
Case description
J.E. is a 55-year-old businessman seen for follow-up of mild hypertension. He is not physically active and he admits to eating “too much.” He does not abuse alcohol. He has no new complaints. His body mass index is 27 kg/m2, and his waist circumference is now 100 cm. His blood pressure is 130/85 mm Hg while taking 25 mg of hydrochlorothiazide daily. He is a non-smoker and has no family history of heart disease. His mother died at age 71 and was overweight and had diabetes. Laboratory findings were as follows: fasting blood glucose, 5.5 mmol/L; total cholesterol (TC), 5.19 mmol/L; low-density lipoprotein (LDL) level, 3.17 mmol/L, high-density lipoprotein (HDL) level, 0.75 mmol/L; triglyceride (TG) level, 2.54 mmol/L. What would your cardiovascular disease (CVD) risk assessment and treatment recommendations be?
Many of our patients are obese and have diabetes or glucose intolerance, and it is becoming apparent that the proportion of the population with these conditions is increasing. Management of their unique risk profiles is of increased importance to family physicians. This metabolic profile consists of borderline-high LDL levels, small LDL particles, high TG levels, and low HDL levels, characterizing atherogenic or mixed dyslipidemia.1 Evaluation of such patients is poorly served by current treatment thresholds and targets that reference LDL cholesterol alone.2–4 These patients are at increased cardiometabolic risk, and can be identified by unique physical and laboratory parameters. Changes in management can further reduce CVD events.5
Cardiovascular mortality rates have fallen almost 40% in the past several decades,6,7 with half of this reduction being the result of known risk factor modification based on targeting LDL levels.8 Hidden in these data, however, is a trend toward a marked slowing in the rate of decline in cardiovascular events and mortality documented in the United States,9 the United Kingdom,10 and Australia.11 This trend might reflect the steady increase in obesity since the 1970s in developed countries, with resulting parallel increases in diabetes and metabolic syndrome.12 Overweight and obese individuals now represent 66% of the population in the United States, with Canada somewhat lower at 52%.13 The prevalence of metabolic syndrome in adults is now 34.3% in the United States14 and 19.1% in Canada.15
While obesity, metabolic syndrome, and diabetes can increase cardiometabolic risk through conventional risk factors, there are emerging risk factors being identified that could be playing an increasing role in residual and unrecognized CVD risk. Some of these factors are implicit in the definition of metabolic syndrome itself, which is a particularly potent predictor of risk in women.16 A harmonized definition of metabolic syndrome is outlined in Table 1.17 Additional emerging risk factors for CVD and death were identified in the INTERHEART study,18 which compared more than 15 000 patients following myocardial infarction with matched controls. Conventional and emerging risk factors are summarized in Table 2.6,7,17,18
Harmonized criteria for metabolic syndrome diagnosis: 3 of 5 positive measures are necessary for diagnosis.
Conventional and emerging cardiometabolic risk factors
It has been recognized that conventional risk factors are less predictive of events in young people and in women.18,19 Indeed, in adults, fully half of cardiovascular events occur in patients with no conventional risk factors.20,21 Patient risk can be further clarified if we consider the emerging concept of the long-term risk of developing cardiovascular events. Conventional short-term risk scores, such as the Framingham score, are influenced overwhelmingly by fixed factors such as age and sex.22 Over a lifetime, multiple borderline factors might interact. Among people with Framingham risk scores of 10 or less over 10 years, half to two-thirds are at high lifetime risk,19,21 and many of these are women and young men. On the other hand, if a patient retains a low Framingham score at age 50, lifetime risk is likely to be low.23–25 The defining features of metabolic syndrome might become particularly useful as relative indicators of lifetime risk,6,7,26,27 as increasing obesity begins to offset the improvements in coronary artery disease mortality achieved in the past few decades.21
Sources of information
References provided with the existing lipid guidelines in North America and Europe6,7,28,29 were initially reviewed. PubMed and the Cochrane database were searched using the key words atherogenic or mixed and dyslipidemia, restricted to English-language clinical trials, randomized controlled trials, and meta-analyses in humans. Articles referencing surrogate outcomes were excluded. References from appropriate retrieved articles were also reviewed. Good-quality evidence was available in the form of randomized trials and meta-analyses to inform most questions.
Main message
Physiology of atherogenic dyslipidemia
The lipid triad composed of elevated LDL, low HDL, and high TG levels is traditionally believed to lead to increased development of CVD. It is known, however, that as LDL levels trend lower, HDL and TG levels become relatively more predictive of CVD events.2,4,30–32 In the presence of abdominal adiposity or diabetes, which usually accompany this lipid combination, glucose is not easily used because of insulin resistance.33 Energy must then be obtained from fat stores, with release of free fatty acids, which prompts increased hepatic production of TGs enclosed within large, highly atherogenic, very low– density lipoprotein (VLDL) particles. The VLDL exchanges this TG for cholesterol with both LDL and HDL particles, and the TG in these smaller particles is then hydrolyzed, producing large numbers of even smaller, denser particles (Figure 1). Small, dense LDL particles contain less cholesterol (hence measured LDL is lower), but they easily penetrate the vascular endothelium, are easily oxidized, and are intensely atherogenic.34–37 The low LDL level belies the importance of increased particle number, which is the parameter associated most strongly with vascular events.31,38 Small HDL particles do not function well, leading to some loss of protective HDL function.39–41 Because of small particle size, considerable HDL particles are lost via the kidney, resulting in reduced measured HDL levels.

Physiology of visceral obesity and insulin resistance
FFA–free fatty acids, HDL–high-density lipoprotein, LDL–low-density lipoprotein, TG–triglyceride, VLDL–very low–density lipoprotein.
The true marker of increased cardiometabolic risk then becomes the atherogenic dyslipidemia triad42,43 of increased LDL particle number, low HDL level, and high TG level. Measured LDL might be low, however, leading to a missed appreciation of true risk. The LDL level simply reflects the amount of cholesterol in LDL particles, and it is not a reliable measure when these particles become small and more numerous, or when substantial cholesterol is carried in VLDL and remnant lipoproteins.44
Among the alternatives to LDL measurement are the TC/HDL ratio and non-HDL cholesterol, which reflect all cholesterol contained in particles containing apolipoprotein B (Apo B) (LDL, VLDL, intermediate-density lipoproteins, and remnant lipoproteins). The best available estimation of particle number is Apo B, as it is a constituent of all atherogenic particles.37,44
Office identification of atherogenic dyslipidemia
Low HDL and high TG levels suggest atherogenic dyslipidemia, and might indicate risk independent of LDL levels. Alternative estimations of atherogenic cholesterol or particle number can give more accurate information. Canadian guidelines endorse using the TC/HDL ratio or non-HDL cholesterol, which are cholesterol measurements, or Apo B, which is a measurement of particle number,6,7 as alternatives to LDL measurement when TG levels are elevated. The US guidelines recommend non-HDL cholesterol (TC minus HDL).28 European guidelines suggest that measurement of either Apo B or non-HDL is acceptable.29 Measurement of Apo B, because it is actually a measure of particle number, is believed by many to be superior31,37,38,44–48 and is supported by Canadian guidelines. However, the forthcoming and highly anticipated Adult Treatment Panel (ATP) IV guidelines might endorse calculation of non-HDL cholesterol.3,45 The ongoing lack of harmonization among guidelines in North America and Europe might perpetuate confusion, possibly leading to poor uptake of any new recommendations.49,50 In an effort to avoid this, many authors argue that calculation of non-HDL is as sensitive as measurement of Apo B, with the advantages of requiring no additional tests, having well established treatment thresholds and goals, and being an adequate reflection of particle number.3,51–53 All tests can be done without fasting, as, unlike with the LDL calculation, TG levels are not required (Table 3).6,7,28,29
Comparison of measurements for cardiometabolic risk
For those who prefer to follow guideline treatment thresholds and targets (Table 4),6,7,28,29 non-HDL measurement might be the preferred test. It can be readily calculated from results of a nonfasting lipid panel, and thresholds and goals are simply 0.8 mmol/L higher than LDL goals.29 While it is only an indirect measure of particle number,31 it does measure all of the cholesterol in particles containing Apo B. Non-HDL levels impart all the information contained in LDL measurement along with additional information on the presence of atherogenic dyslipidemia without the need to measure TG levels.54
Guideline comparisons for treatment thresholds and targets
Risk assignment and treatment thresholds
Conventional 10-year risk of CVD is calculated using the Framingham risk score. The Canadian Cardiovascular Society dyslipidemia guidelines6,7 are the most evidence based,55 and a calculator is now available for mobile devices.
A model relating the various risk factor characteristics in Table 26,7,17,18 to appropriate laboratory measurements is represented in Figure 2.6,7,17,18 A desktop calculator for the Framingham score using Canadian guidelines and including optional support for this extended model is available online (www.palmedpage.com/Framingham/Framingham%20Risk%20Calculator.htm). This desktop tool will calculate non-HDL levels and TC/HDL ratio, estimate numbers needed to treat, and provide detection and decision support for atherogenic dyslipidemia.
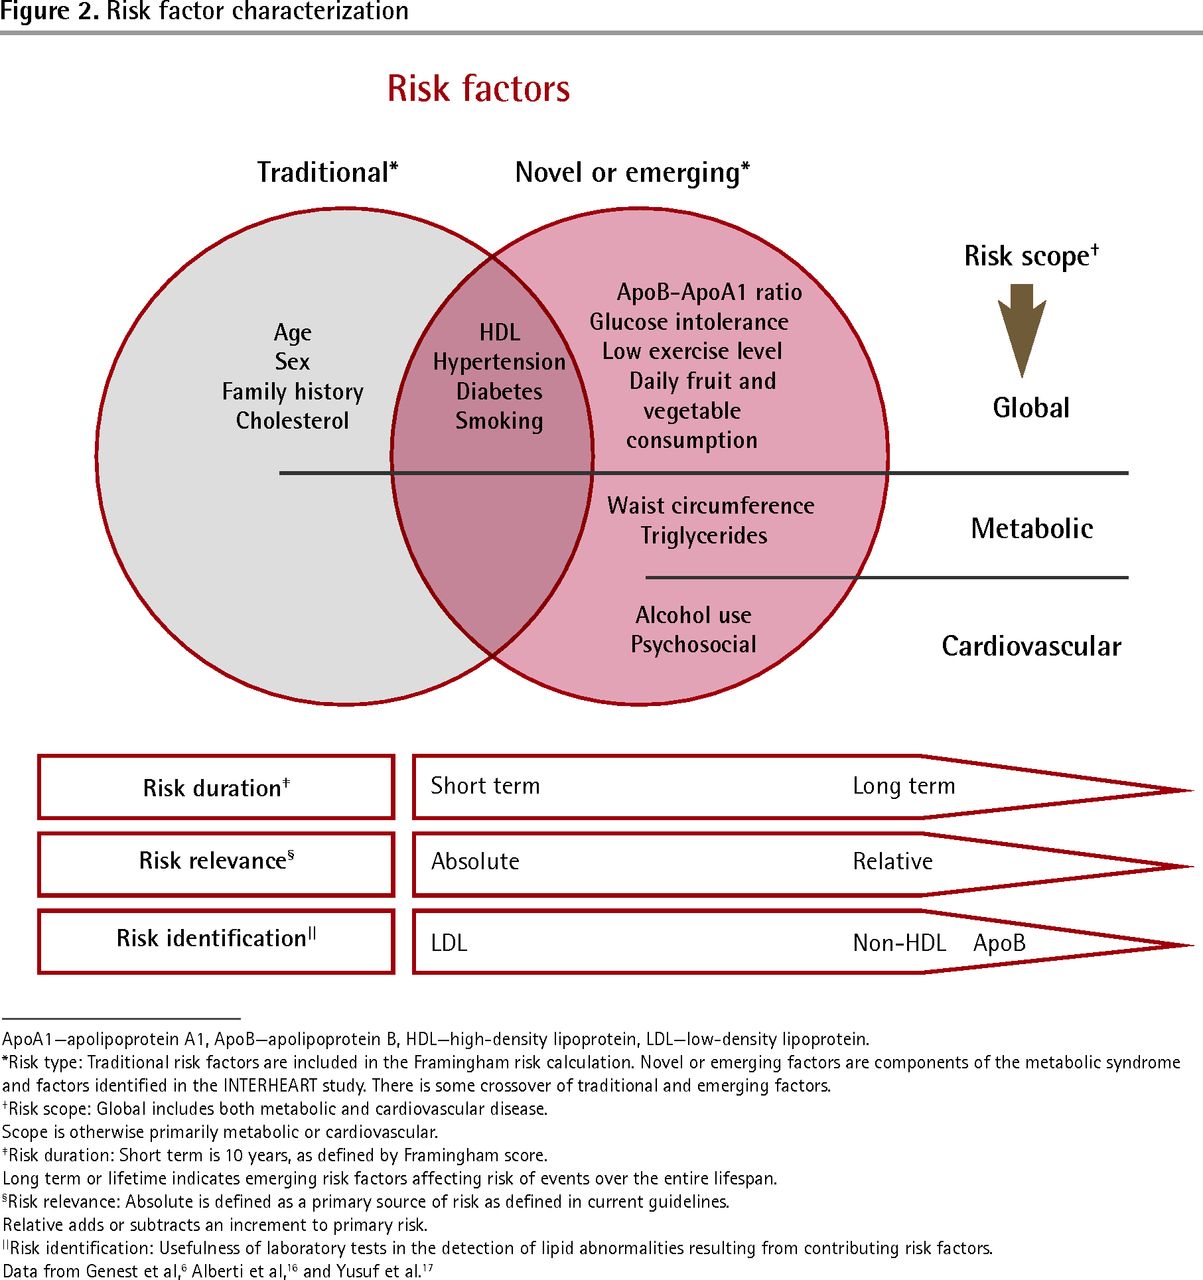
Risk factor characterization
ApoA1–apolipoprotein A1, ApoB–apolipoprotein B, HDL–high–density lipoprotein, LDL–low–density lipoprotein.
*Risk type: Traditional risk factors are included in the Framingham risk calculation. Novel or emerging factors are components of the metabolic syndrome and factors identified in the INTERHEART study. There is some crossover of traditional and emerging factors.
†Risk scope: Global includes both metabolic and cardiovascular disease.
Scope is otherwise primarily metabolic or cardiovascular.
‡Risk duration: Short term is 10 years, as defined by Framingham score.
Long term or lifetime indicates emerging risk factors affecting risk of events over the entire lifespan.
§Risk relevance: Absolute is defined as a primary source of risk as defined in current guidelines.
Relative adds or subtracts an increment to primary risk.
||Risk identification: Usefulness of laboratory tests in the detection of lipid abnormalities resulting from contributing risk factors.
Data from Genest et al,6 Alberti et al,16 and Yusuf et al.17
In order to take into account the increased relative influence of emerging risk factors, 4 possible courses of action exist. Best evidence for each approach is evaluated in Table 5.16,53,56–63
Comparing level and quality of best evidence for lipid markers in making treatment decisions
-
Calculate the conventional risk score, and if metabolic syndrome is present increase this by a multiple of 1.5 for men and 2.0 for women. This multiple comes from a meta-analysis of prospective cohort studies16 and its use is endorsed by the Canadian guidelines. The presence of metabolic syndrome will usually place the patient at high risk.
-
Use the TC/HDL ratio for calculation of treatment thresholds and targets in place of LDL values. This is supported by Canadian guidelines, and there is good support in the literature.55,64–67
-
Calculate non-HDL cholesterol from the lipid panel results, and decide on treatment thresholds by adding 0.8 mmol/L to levels given for LDL. This has good support in the literature and is likely to be recommended in the new ATP IV guidelines.
-
Order measurement of Apo B levels if the patient has multiple emerging risk factors or low HDL or high TG levels. A single treatment threshold and a single target are given in the Canadian guidelines for all levels of risk. Coverage of the cost of this test is inconsistent.
With the exception of option 1, these approaches require no fasting and are valid in place of LDL measurement for all patients at all risk levels. Simple calculation of non-HDL level and TC/HDL ratio could easily be done for all fasting and nonfasting lipid panels. It remains uncertain whether the ATP IV guidelines will move to use of non-HDL level as a standard.
Treatment decision
Once risk has been calculated and a treatment threshold has been generated, it is important to reach a shared, informed decision with the patient. Understanding the numbers needed to treat might be helpful, especially as statins offer benefit at all levels of risk,68 although benefits become vanishingly small when risk is low, especially when balanced against adverse effects and numbers needed to harm (Table 6).69–80 While some high-risk patients with low LDL levels might become candidates for lipid-lowering therapy using this strategy, some patients might conversely avoid drug treatment despite higher LDL levels because of elevated HDL levels acquired through inheritance or exercise. The presence of a number of emerging risk factors, especially abdominal obesity and glucose intolerance, might add considerably to lifetime risk and should be considered as well.
Adverse effects of statins in primary prevention
Aggressive statin therapy seems to have the strongest evidence for improvement of atherogenic dyslipidemia.81 There has been evidence for some time from high-dose statin trials20,82–86 and meta-analyses83,87–91 that cholesterol lowering in patients with “normal” levels of LDL results in further CVD mortality reduction in both primary and secondary prevention. There also exists a residual 20% incidence of repeat cardiovascular events in patients who have had initial events, even though lipid levels and risk factors were thought to be controlled.84 These findings imply that there is potential for further cardiovascular mortality improvement from statin therapy even when LDL levels are at goal levels according to current guidelines. Some of this benefit might be a result of the reduction of unrecognized risk from atherogenic dyslipidemia. There is ample evidence from large trials that patients with metabolic syndrome derive greater absolute benefit from use of statins,92–96 perhaps in part because their initial risk of CVD events is higher.
An option for simplifying statin administration is to place less importance on targets. Statin trials have been randomized to treatment or to dose, but never to LDL targets.87,97 Recognizing this, the main priority is to ensure that the patient is actually taking the drug,55 as two-thirds of the benefit from statin use occurs with administration of the initial dose.98 Once adequate compliance has been achieved, the dose can be gradually titrated to a level determined by patient tolerance99 rather than to a treatment target.
Additions to statin therapy
Addition of a second drug to a statin might improve the lipid profile, but with one exception there is no good evidence that this improves hard outcomes. There is currently evidence supporting use of fenofibrate along with statins for reduction in cardiovascular events or mortality, but only in patients with low HDL and high TG levels.100–103 Drug interaction with statins seems to be minimal for fenofibrate.81,104,105 Recent combination studies with niacin, omega-3 fatty acids, ezetimibe, and cholesterol ester transfer protein inhibitors have either shown no benefit or were stopped early owing to futility (Table 7).93,100,101,103,104,106–119 No combination trials have been done using resins.119 Thus, the only evidence for reduced risk of death or CVD resulting from combination therapy with optimized statin treatment at present is for fenofibrate, and only in those with the specific mixed dyslipidemic profile.102
Best evidence for drugs used alone or in combination with statins
Intolerance to statin therapy
Statins confer such overwhelming benefit to high-risk patients that in patients who cannot tolerate statin therapy it is important to try changes in dosage levels and timing, and to consider alternate statins, before switching to alternative drugs. A 3-fold rise in liver enzymes can be tolerated, and in the event of high enzymes caused by hepatic steatosis, improvement can be expected with continued statin use.120 In the absence of symptoms of myopathy, a rise of less than 10-fold in creatine kinase level can simply be followed.69
In the event of absolute intolerance to statins there is solid evidence from older studies of considerable benefit for both niacin and fibrates used alone. This benefit is seen for both CVD events and mortality in all patients meeting treatment criteria (Table 7).93,100,101,103,104,106–119 Evidence for benefit of fish oils has come from older observational and cohort studies, but recent meta-analyses115–117 have not been able to demonstrate improvement in outcomes. Similarly, the evidence for benefit with use of resins is weak.119 Ezetimibe has not been studied as a single agent, nor has it been evaluated without a combined statin. All trials suggesting benefit have referenced lipid levels or other surrogate outcomes.121 Cholesterol ester transfer protein inhibitor trials, despite remarkable elevations in HDL levels, have thus far shown no benefit in outcomes.122
Case revisited
J.E.’s Framingham risk score is 15.6% over 10 years according to the Canadian guideline calculator. His LDL level is 3.17 mmol/L, which is below the treatment threshold of greater than 3.5 mmol/L. He has abdominal obesity and low HDL and high TG levels, constituting metabolic syndrome and, therefore, has increased relative cardiometabolic risk. His calculated non-HDL cholesterol is 4.44 mmol/L (5.19 − 0.75 = 4.44 mmol/L). This is higher than the calculated treatment threshold for non-HDL (3.50 + 0.80 = 4.30 mmol/L). His TC/HDL ratio is 6.8, which exceeds the treatment threshold of 5 mmol/L. By either of these calculations, all cholesterol hiding in Apo B particles outside of LDL is accounted for, and treatment would be indicated even if LDL levels were normal. A decision could have been made without a fasting TG measurement.
The patient has consulted a dietitian and has begun a program under the supervision of a certified exercise trainer for the past 2 weeks. His weight is unchanged, but his waist circumference is down to 98 cm. He is informed of his moderate 10-year risk together with the relative increased longer-term risk imparted by metabolic syndrome, which places him at high 10-year and long-term risk. He agrees to a statin trial and is able to tolerate 80 mg of atorvastatin daily.
One year after the intervention he is compliant with exercise recommendations, but less so with diet. Weight and blood pressure are unchanged, but waist circumference is down to 94 cm. Laboratory results are as follows: TC, 3.5 mmol/L; HDL, 0.95 mmol/L; non-HDL, 2.55 mmol/L; TC/HDL ratio, 3.6 (nonfasting). There has been no change in liver enzymes. These values meet treatment goals provided he can remain compliant with diet and exercise. He is encouraged to continue taking his statin and to follow up with the dietitian. He might consider dropping to a moderate 40-mg dose of statin if he can improve his dietary compliance.
Treatment recommendations are summarized in Box 1.6,7,17,18,28,29,109,123
Treatment recommendations
Consider the following treatment recommendations:
|
HDL—high-density lipoprotein, LDL—low-density lipoprotein, TC—total cholesterol, TG—triglyceride.
Conclusion
Low-density lipoprotein levels have been beneficial in calculating Framingham risk, which is a short-term estimation, heavily influenced by age. Increasing incidence of obesity is accompanied by increasing glucose intolerance and metabolic syndrome leading to a more long-term cardiometabolic risk, which is poorly predicted by LDL levels. This resulting atherogenic dyslipidemia is characterized by novel risk factors, including the diagnostic features of metabolic syndrome, atherogenic diet, and lack of exercise. These factors combine over time to increase longer-term risk of CVD, and are particularly predictive in women and younger people. Non-HDL cholesterol level or TC/HDL ratio can be used in place of LDL measurement in establishing treatment thresholds and targets, are easily calculated from non-fasting serum, and should be routinely reported on lipid panels.
Atherogenic dyslipidemia, once identified, requires renewed attention to maladaptive dietary, exercise, and smoking habits, as changes in these habits will have a potent effect on risk reduction. Drug treatment involves optimization of compliance to a statin dosage based on drug tolerance, rather than lipid targets. Fenofibrate might provide further benefit if TG levels are high and HDL levels are low. Fibrates or niacin alone have shown benefit in the event of absolute intolerance to statins.
Notes
EDITOR’S KEY POINTS
-
Cardiovascular mortality rates have fallen almost 40% in the past several decades; however, the increasing prevalence of obesity, leading to atherogenic dyslipidemia, has begun to offset these improvements.
-
In adults, half of cardiovascular events occur in patients with no conventional risk factors. Conventional short-term measures of risk are influenced overwhelmingly by fixed factors such as age and sex, and so are less predictive of events particularly in young people and in women. Patient risk can be further clarified by considering the emerging concept of the long-term risk of developing cardiovascular events.
-
Ways of evaluating atherogenic dyslipidemia leading to long-term risk include modifying conventional risk scores in the context of metabolic syndrome (by a multiple of 1.5 for men and 2.0 for women); using the total cholesterol–high-density lipoprotein (HDL) ratio for calculation of treatment thresholds and targets; calculating non-HDL cholesterol from lipid panel results, and determining treatment thresholds by adding 0.8 mmol/L to levels given for low-density lipoprotein; or measuring apolipoprotein B levels if the patient has multiple emerging risk factors or low HDL or high triglyceride levels.
Footnotes
-
This article is eligible for Mainpro-M1 credits. To earn credits, go to www.cfp.ca and click on the Mainpro link.
-
This article has been peer reviewed.
-
La traduction en français de cet article se trouve à www.cfp.ca dans la table des matières du numéro de novembre 2013 à la page e479.
-
Competing interests
None declared
- Copyright© the College of Family Physicians of Canada
References
- 1.↵
- 2.↵
- 3.↵
- 4.↵
- 5.↵
- 6.↵
- 7.↵
- 8.↵
- 9.↵
- 10.↵
- 11.↵
- 12.↵
- 13.↵
- 14.↵
- 15.↵
- 16.↵
- 17.↵
- 18.↵
- 19.↵
- 20.↵
- 21.↵
- 22.↵
- 23.↵
- 24.
- 25.↵
- 26.↵
- 27.↵
- 28.↵
- 29.↵
- 30.↵
- 31.↵
- 32.↵
- 33.↵
- 34.↵
- 35.
- 36.
- 37.↵
- 38.↵
- 39.↵
- 40.
- 41.↵
- 42.↵
- 43.↵
- 44.↵
- 45.↵
- 46.
- 47.
- 48.↵
- 49.↵
- 50.↵
- 51.↵
- 52.
- 53.↵
- 54.↵
- 55.↵
- 56.↵
- 57.
- 58.
- 59.
- 60.
- 61.
- 62.
- 63.↵
- 64.↵
- 65.
- 66.
- 67.↵
- 68.↵
- 69.↵
- 70.
- 71.
- 72.
- 73.
- 74.
- 75.
- 76.
- 77.
- 78.
- 79.
- 80.↵
- 81.↵
- 82.↵
- 83.↵
- 84.↵
- 85.
- 86.↵
- 87.↵
- 88.
- 89.
- 90.
- 91.↵
- 92.↵
- 93.↵
- 94.
- 95.
- 96.↵
- 97.↵
- 98.↵
- 99.↵
- 100.↵
- 101.↵
- 102.↵
- 103.↵
- 104.↵
- 105.↵
- 106.↵
- 107.
- 108.
- 109.↵
- 110.
- 111.
- 112.
- 113.
- 114.
- 115.↵
- 116.
- 117.↵
- 118.
- 119.↵
- 120.↵
- 121.↵
- 122.↵
- 123.↵


