


Article Figures & Data
Figures
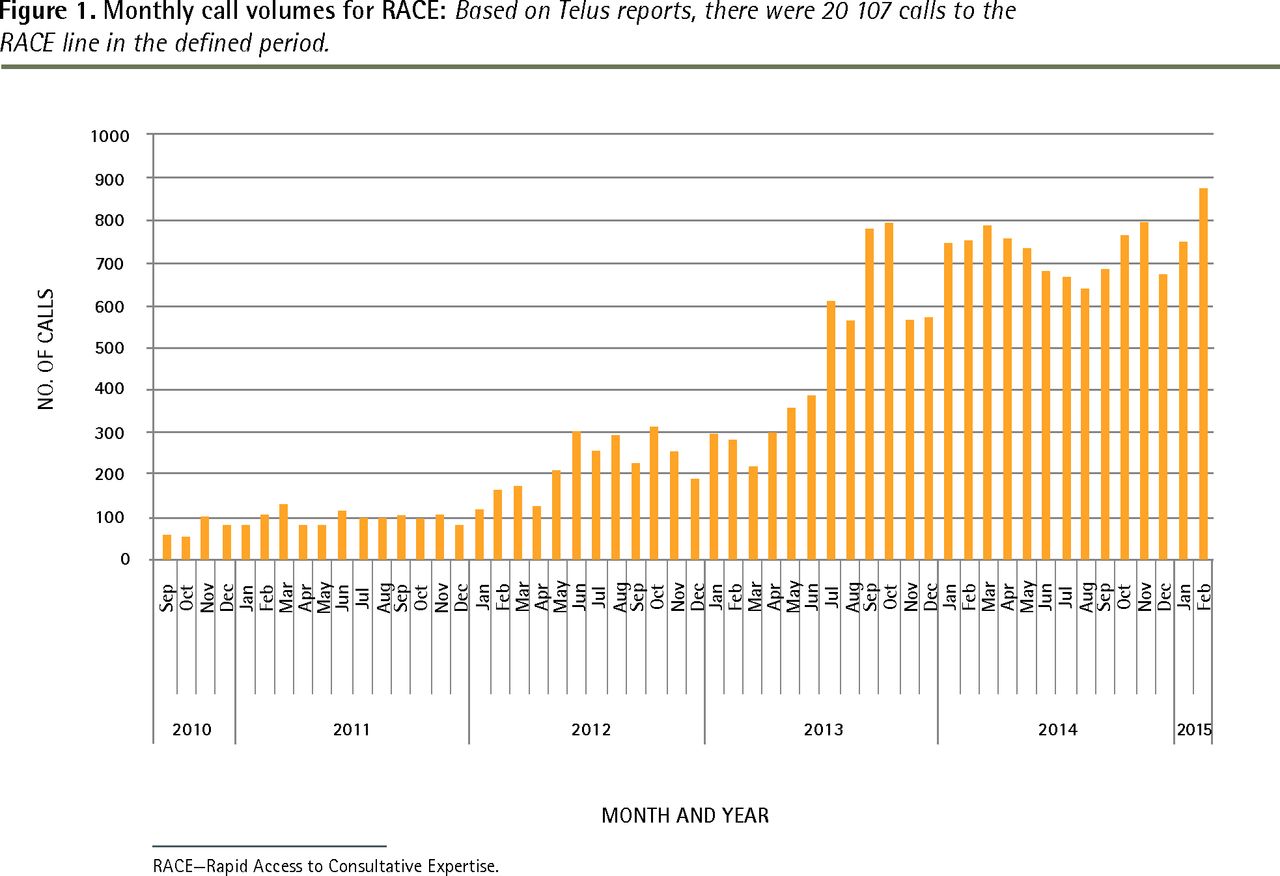
- Figure 1.
Monthly call volumes for RACE: Based on Telus reports, there were 20 107 calls to the RACE line in the defined period.
RACE—Rapid Access to Consultative Expertise.
Tables
FEE SPECIALTY CARD HF RM GIM GI GERI RESP PSYC ENDO RENAL Initial consultation, $ 166.15 166.20 166.20 161.10 155.00 171.00 163.10 211.45 177.25 155.10 Card—cardiology, Endo—endocrinology, Geri—geriatrics, GI—gastroenterology, GIM—general internal medicine, HF—heart failure, Psyc—adult psychiatry, Resp—respirology, RM—risk management.
Data from the Medical Services Commission.6
- Table 2.
Per-call savings by specialty: Specialists reported data for 40% of the initial 5000 calls; 148 of these calls had complete information on the avoided ED visits and face-to-face consultations.
VARIABLE CARD HF RM GIM GI GERI RESP PSYC ENDO RENAL TOTAL RACE CALLS Total no. of calls 25 7 3 24 5 6 6 14 48 10 148 No. of calls that prevented specialist consultations 14 2 2 14 0 6 1 6 37 4 86 No. of calls that prevented ED visits 8 0 1 10 3 4 5 5 11 1 48 Costs, $ Total direct costs* (A) 2550 714 306 2448 510 612 612 1428 4896 1020 15 096 Savings, $ Direct variable cost avoidance • Avoiding specialist consultations† 2326 332 332 2255 0 1028 163 1269 6558 621 14 885 • Avoiding ED visits‡ 1536 0 192 1920 576 768 960 960 2112 192 9216 Total savings (B) 3862 332 524 4175 576 1796 1123 2229 8670 813 24 101 Actual savings (B - A) 1312 −382 218 1727 66 1184 511 801 3774 −207 9005 Per-call cost avoidance§ 52 −55 73 72 13 197 85 57 79 −21 61 Card—cardiology, ED—emergency department, Endo—endocrinology, Geri—geriatrics, GI—gastroenterology, GIM—general internal medicine, HF—heart failure, Psyc—adult psychiatry, RACE—Rapid Access to Consultative Expertise, Resp—respirology, RM—risk management.
↵* No. of calls × $102.12, the average fee charged for a RACE call.
↵† Direct variable savings by avoiding specialist face-to-face consultations = no. of calls that prevented specialist consultations × specialist initial consultation fee (Table 1).6
↵‡ Direct variable savings by avoiding ED visits = no. of calls that resulted in avoiding ED visits × ED visit fees ($192).
↵§ Actual savings divided by total no. of calls.
In this issue


Jump to section
Related Articles
Cited By...
- Impact of the Connected Medicine collaborative in improving access to specialist care: a cross-sectional analysis
- Telemedicine in the drivers seat: new role for primary care access in Brazil and Canada: The Besrour Papers: a series on the state of family medicine in Canada and Brazil
- Right-Site Care Programme with a community-based family medicine clinic in Singapore: secondary data analysis of its impact on mortality and healthcare utilisation