
Main menu

  • Home
  • Articles
    • Current
    • Published Ahead of Print
    • Archive
    • Supplemental Issues
    • Collections - French
    • Collections - English
  • Info for
    • Authors & Reviewers
    • Submit a Manuscript
    • Advertisers
    • Careers & Locums
    • Subscribers
    • Permissions
  • About CFP
    • About CFP
    • About the CFPC
    • Editorial Advisory Board
    • Terms of Use
    • Contact Us
  • Feedback
    • Feedback
    • Rapid Responses
    • Most Read
    • Most Cited
    • Email Alerts
  • Blogs
    • Latest Blogs
    • Blog Guidelines
    • Directives pour les blogues
  • Mainpro+ Credits
    • About Mainpro+
    • Member Login
    • Instructions
  • Other Publications
    • http://www.cfpc.ca/Canadianfamilyphysician/
    • https://www.cfpc.ca/Login/
    • Careers and Locums

User menu

  • My alerts

Search

  • Advanced search
The College of Family Physicians of Canada
  • Other Publications
    • http://www.cfpc.ca/Canadianfamilyphysician/
    • https://www.cfpc.ca/Login/
    • Careers and Locums
  • My alerts
The College of Family Physicians of Canada

Advanced Search

  • Home
  • Articles
    • Current
    • Published Ahead of Print
    • Archive
    • Supplemental Issues
    • Collections - French
    • Collections - English
  • Info for
    • Authors & Reviewers
    • Submit a Manuscript
    • Advertisers
    • Careers & Locums
    • Subscribers
    • Permissions
  • About CFP
    • About CFP
    • About the CFPC
    • Editorial Advisory Board
    • Terms of Use
    • Contact Us
  • Feedback
    • Feedback
    • Rapid Responses
    • Most Read
    • Most Cited
    • Email Alerts
  • Blogs
    • Latest Blogs
    • Blog Guidelines
    • Directives pour les blogues
  • Mainpro+ Credits
    • About Mainpro+
    • Member Login
    • Instructions
  • RSS feeds
  • Follow cfp Template on Twitter
  • LinkedIn
  • Instagram
Research ArticleResearch

Relationship between income and mortality in a Canadian family practice cohort

Murray Finkelstein
Canadian Family Physician April 2018; 64 (4) e181-e189;
Murray Finkelstein
Retired family physician who practised in the Family Medicine Centre at Mount Sinai Hospital in Toronto, Ont.
PhD MD CCFP
  • Find this author on Google Scholar
  • Find this author on PubMed
  • Search for this author on this site
  • For correspondence: murray.finkelstein@utoronto.ca
  • Article
  • Figures & Data
  • eLetters
  • Info & Metrics
  • PDF
Loading

Article Figures & Data

Figures

  • Tables
  • Figure 1.
    • Download figure
    • Open in new tab
    Figure 1.

    Residence locations of the study patients: Each patient is represented by a circle. The clinic is located in downtown Toronto, Ont.
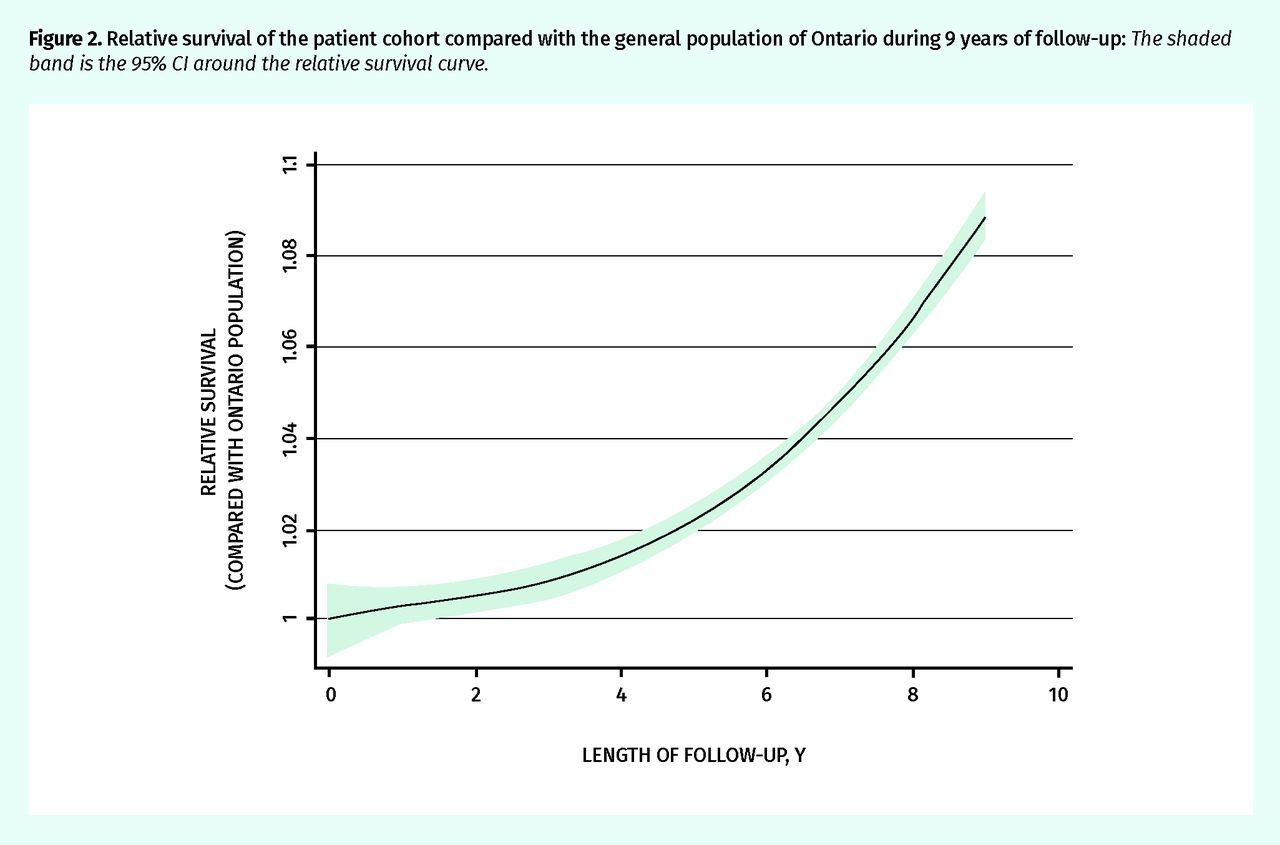
  • Figure 2.
    • Download figure
    • Open in new tab
    Figure 2.

    Relative survival of the patient cohort compared with the general population of Ontario during 9 years of follow-up: The shaded band is the 95% CI around the relative survival curve.

Tables

  • Figures
    • View popup
    Table 1.

    Patient demographic characteristics

    CHARACTERISTICSFEMALE PATIENTS (N = 317)MALE PATIENTS (N = 202)
    Median (IQR) age, y58 (50 to 67)62 (52 to 69)
    Median (IQR) BMI, kg/m224.3 (22.1 to 27.7)25.7 (23.6 to 27.4)
    Median (IQR) neighbourhood income (based upon postal code linkage to census), $46 000 (35 000–63 000)48 000 (34 000–62 000)
    High school graduate, n (%)267 (86)162 (83)
    Born in Canada, n (%)176 (56)107 (53)
    Alcohol use in the year before the survey, n (%)
      • None57 (18)24 (12)
      • ≤ 1 per week151 (48)81 (41)
      • ≥ 1 per week106 (34)95 (48)
    Ever smoked cigarettes, n (%)176 (56)133 (66)
    Cancer diagnosis,* n (%)77 (24)59 (29)
    Hypertension,* n (%)134 (42)76 (38)
    Diabetes,* n (%)39 (12)37 (18)
    Household income per annum (imputed), n (%)
      • < $20 00035 (11)20 (10)
      • $20 000 to < $40 00050 (16)30 (15)
      • $40 000 to < $60 00047 (15)25 (12)
      • $60 000 to < $80 00035 (11)18 (9)
      • ≥ $80 000150 (47)109 (54)
    Categorical income of < $60 000 per annum, n (%)132 (42)75 (37)
    • BMI—body mass index, IQR—interquartile range.

    • ↵* Before the survey.

    • View popup
    Table 2.

    Health-related behaviour and personal factors, by income and sex

    HEALTH-RELATED BEHAVIOUR AND PERSONAL FACTORSINCOME < $60 000INCOME ≥ $60 000
    MALEFEMALEMALEFEMALE
    BMI (centred), kg/m2, mean (95% CI)0.29 (−0.5 to 1.1)1.32 (0.2 to 2.5)0.24 (−0.4 to 0.8)−0.99 (−1.6 to −0.4)
    Ever smoked daily, % (95% CI)63 (52 to 74)52 (43 to 60)57 (48 to 65)46 (39 to 53)
    Current smoker, % (95% CI)13 (6 to 21)17 (11 to 24)4 (1 to 7)9 (5 to 13)
    Never drank alcohol in the past year, % (95% CI)20 (11 to 30)28 (20 to 36)9 (4 to 15)12 (7 to 17)
    Born in Canada, % (95% CI)51 (39 to 62)49 (41 to 58)55 (46 to 64)60 (53 to 67)
    High school graduate, % (95% CI)65 (54 to 76)79 (72 to 86)94 (89 to 98)91 (87 to 96)
    Diabetes, % (95% CI)27 (17 to 37)17 (10 to 23)13 (7 to 19)9 (5 to 13)
    Hypertension, % (95% CI)43 (31 to 54)47 (38 to 56)35 (26 to 43)39 (32 to 46)
    Cancer, % (95% CI)27 (17 to 37)25 (18 to 32)31 (23 to 39)24 (18 to 30)
    • BMI—body mass index.

    • View popup
    Table 3.

    The results of the regression model examining explanatory variables for mortality: The model is adjusted for age and BMI.

    RISK FACTORRELATIVE RISK (95% CI)
    Female vs male0.47 (0.27 to 0.82)
    Imputed income (categorical variable with 5 categories, treated as continuous from low to high income)0.75 (0.59 to 0.96)
    High school graduate vs non-graduate1.05 (0.54 to 2.04)
    Born in Canada vs immigrant1.76 (0.99 to 3.12)
    Ever smoked daily vs never smoked daily2.17 (1.15 to 4.09)
    Alcohol use during the previous year
      • > 1 drink per week1.0 (reference)
      • ≤ 1 drink per week1.91 (0.90 to 4.02)
      • None4.22 (1.81 to 9.85)
    Diabetes diagnosis before survey2.74 (1.46 to 5.13)
    Hypertension before survey1.39 (0.76 to 2.53)
    Cancer before survey1.93 (1.07 to 3.50)
    • BMI—body mass index.

    • View popup
    Table 4.

    Final model with different income parameterizations

    INCOME PARAMETERIZATIONRATE RATIO (95% CI)
    Parameterization 1
    Categorical income (as continuous variable)0.75 (0.59 to 0.95)
    Parameterization 2
    Categorical income (by categories) per annum
       • < $20 0001.0 (reference)
       • $20 000 to < $40 0000.81 (0.35 to 1.88)
       • $40 000 to < $60 0000.98 (0.40 to 2.42)
       • $60 000 to < $80 0000.17 (0.02 to 1.30)
       • ≥ $80 0000.34 (0.12 to 0.97)
    Parameterization 3
    Income of < $60 000 per annum vs income of ≥ $60 000 per annum2.18 (1.18 to 4.02)
PreviousNext
Back to top

In this issue

Canadian Family Physician: 64 (4)
Canadian Family Physician
Vol. 64, Issue 4
1 Apr 2018
  • Table of Contents
  • About the Cover
  • Index by author
Print
Download PDF
Article Alerts
Sign In to Email Alerts with your Email Address
Email Article

Thank you for your interest in spreading the word on The College of Family Physicians of Canada.

NOTE: We only request your email address so that the person you are recommending the page to knows that you wanted them to see it, and that it is not junk mail. We do not capture any email address.

Enter multiple addresses on separate lines or separate them with commas.
Relationship between income and mortality in a Canadian family practice cohort
(Your Name) has sent you a message from The College of Family Physicians of Canada
(Your Name) thought you would like to see the The College of Family Physicians of Canada web site.
CAPTCHA
This question is for testing whether or not you are a human visitor and to prevent automated spam submissions.
Citation Tools
Relationship between income and mortality in a Canadian family practice cohort
Murray Finkelstein
Canadian Family Physician Apr 2018, 64 (4) e181-e189;

Citation Manager Formats

  • BibTeX
  • Bookends
  • EasyBib
  • EndNote (tagged)
  • EndNote 8 (xml)
  • Medlars
  • Mendeley
  • Papers
  • RefWorks Tagged
  • Ref Manager
  • RIS
  • Zotero
Respond to this article
Share
Relationship between income and mortality in a Canadian family practice cohort
Murray Finkelstein
Canadian Family Physician Apr 2018, 64 (4) e181-e189;
Twitter logo Facebook logo Mendeley logo
  • Tweet Widget
  • Facebook Like
  • Google Plus One

Jump to section

  • Article
    • Abstract
    • METHODS
    • RESULTS
    • DISCUSSION
    • Notes
    • Footnotes
    • References
  • Figures & Data
  • eLetters
  • Info & Metrics
  • PDF

Related Articles

  • No related articles found.
  • PubMed
  • Google Scholar

Cited By...

  • No citing articles found.
  • Google Scholar

More in this TOC Section

  • Electronic consultation questions asked to addiction medicine specialists by primary care providers
  • Sociodemographic variation in use of and preferences for digital technologies among patients in primary care
  • Prevalence and management of symptom diagnoses in children in general practice
Show more Research

Similar Articles

Subjects

  • Collection française
    • Résumés de recherche

Navigate

  • Home
  • Current Issue
  • Archive
  • Collections - English
  • Collections - Française

For Authors

  • Authors and Reviewers
  • Submit a Manuscript
  • Permissions
  • Terms of Use

General Information

  • About CFP
  • About the CFPC
  • Advertisers
  • Careers & Locums
  • Editorial Advisory Board
  • Subscribers

Journal Services

  • Email Alerts
  • Twitter
  • LinkedIn
  • Instagram
  • RSS Feeds

Copyright © 2025 by The College of Family Physicians of Canada

Powered by HighWire