


Abstract
Objective To understand disparities in primary care patient experience.
Design A serial cross-sectional study was conducted to understand disparities in patient experience at 2 time points (2014 and 2016). Disparities related to age, gender, neighbourhood income, and self-rated health were explored using 3 analytic approaches: stratification, logistic regression, and relative comparison across multiple demographic variables.
Setting A multisite family health team in Toronto, Ont.
Participants Patients in the family medicine practice who completed e-mail surveys in 2014 (n = 1171, 19% response rate) and 2016 (n = 1823, 15% response rate).
Main outcome measures Patient-reported access (timely access when sick, access after hours) and patient-centredness (opportunity to ask questions, involvement in care decisions, enough time with provider).
Results Performance for all measures improved between 2014 and 2016, with the greatest absolute improvement seen in access after hours (61% in 2014; 75% in 2016). Patients residing in low-income neighbourhoods reported worse patient experiences than those in high-income neighbourhoods did, as did patients with poor versus excellent self-rated health, even after adjustment for other variables. For example, in 2016, 60% of patients residing in low-income neighbourhoods reported timely access when sick versus 70% in high-income neighbourhoods (adjusted odds ratio of 0.67, 95% CI 0.47 to 0.95); 60% of patients with poor or fair self-rated health reported timely access when sick versus 72% with excellent self-rated health (adjusted odds ratio of 0.54, 95% CI 0.35 to 0.84). Comparing across demographic groups, patients with excellent self-rated health and poor or fair self-rated health reported the best and worst experiences, respectively, for all measures. In 2016, the average disparity between subgroups was largest for access after hours.
Conclusion In this setting, patient experience was worse for patients in lower-income neighbourhoods and those with poor or fair self-rated health. Access after hours demonstrated the greatest overall absolute improvement but also the greatest widening of disparities.
Health equity is an integral component of quality improvement and is 1 of the 6 domains of high-quality health care of the Institute of Medicine framework.1 Equity in health can be defined as the absence of systemic differences across sociodemographic groups in 1 or more areas of health, including health services.2 The addition of this domain represents a commitment to improving quality of care that benefits all patients and closing unjust gaps in health care quality and outcomes.1,3 However, there is concern that, despite its inclusion as 1 of the 6 domains, quality improvement work in equity is not a priority, falling behind other aims such as patient safety and efficiency. The Institute for Healthcare Improvement published a white paper on health equity, referring to it as the “forgotten aim.”4 Additionally, a systematic review revealed that in leading scientific journals on quality improvement, few articles focus on equity-related topics.5
Alongside clinical quality and patient safety, patient experience has been established as 1 of the key pillars of high-quality health care.1,6 Most commonly, patient experience in Canada is reported regionally with little examination of variation by subgroups, particularly in primary care.7,8 When assessed, variation in experience by subgroup is generally only considered at a single point in time.9 Measuring disparities between subpopulations is the first step to understanding equity. Disparity assesses difference, while equity denotes a value judgment about whether that difference is unfair.10
In the primary care setting in Ontario, the use of surveys to assess patient experience is mandatory for all family health teams and community health centres.11 However, there is little guidance for equity-oriented analysis of patient experience data at a practice level. As we embark on quality improvement efforts, there can be unintentional consequences including potential worsening of existing disparities. This can happen if improvements are made at a faster rate for certain subpopulations compared with others; these disparities can be masked by overall improvements for the whole population.4
Since 2014, our family health team has routinely been surveying patients about their experience with timely access and patient-centredness and is engaged in related improvement efforts.12 We sought to use different analytic methods to understand disparities in patient-reported access and patient-centredness over time. We hoped this research would inform a practice-based approach to understanding and improving equity in patient experience in primary care.
METHODS
Setting
The St Michael’s Hospital Academic Family Health Team (SMHAFHT) provides interprofessional primary care to approximately 45 000 patients at 6 clinics in Toronto, Ont. The SMHAFHT serves a diverse population including young urban professionals, new immigrants, refugees, people living in poverty, people with HIV, people with mental health and addiction issues, and members of the LGBTQ2S+ (lesbian, gay, bisexual, trans, queer or questioning, or 2-spirited, and members of related communities) population. As part of ongoing quality improvement initiatives, the SMHAFHT developed a survey that seeks to understand patients’ experiences with timely access and patient-centredness, available from CFPlus.* Since 2014, all patients with an e-mail address on file have been e-mailed the survey every year during their birth month.
Study design
We conducted a cross-sectional analysis of responses from e-mail surveys completed from January 1, 2014, to December 31, 2014, and from January 1, 2016, to December 31, 2016. We analyzed responses for 5 outcome measures: timely access when sick, ease of access after hours, opportunity to ask questions, involvement in care decisions, and having enough time with health providers. Patients were asked to rate their experiences on a Likert scale. In this study, we present their responses as dichotomized responses (ie, always or often versus sometimes, rarely, or never).
The following demographic characteristics were collected by the survey: age, gender, postal code, and self-rated health. Using the postal codes provided, we derived the corresponding neighbourhood income quintile using a conversion file based on census data from 2006, the most recent complete census data available.13 The protocol was formally reviewed by institutional authorities at St Michael’s Hospital and deemed to neither require research ethics board approval nor written informed consent from participants.
Approaches to measuring disparities
Stratification by demographic characteristics. We calculated descriptive statistics for all 5 outcome measures after stratification by demographic characteristics and survey year. We used η2 tests to compare respondents from the 2014 survey to the 2016 survey to assess if the demographic profiles were similar.
Regression analysis. We used logistic regression with 2016 survey data to estimate the magnitudes of disparities between patients with different neighbourhood incomes and self-rated health. Income and self-rated health were correlated, so we fitted separate models. We compared the results before and after adjustment for the potential confounders of age and gender.
Comparing disparities across multiple demographic characteristics (“bottom-up approach”). The bottom-up approach, as described in the Institute for Healthcare Improvement’s white paper on health equity, is an effective way to compare disparities across multiple subgroups at 1 time point.4,14 In this analytic approach, an outcome of interest is measured across different subgroups. The subgroup with the best outcomes (most advantaged group) becomes the reference group. The differences between the reference group and the other subgroups are calculated. The bottom-up approach allows us to understand the disparities among subgroups relative to the most advantaged group. Also, this approach includes a summary statistic to depict the overall degree of inequality. It is calculated by averaging the absolute differences between the subgroups and reference group. The larger the summary statistic, the larger the degree of inequality.
In our analysis, we focused on 6 subgroups of interest: female gender, male gender, lowest neighbourhood income quintile (Q1), highest neighbourhood income quintile (Q5), poor or fair self-rated health, and excellent self-rated health. We did not include age as a construct in our bottom-up approach as there was no clear reference group. We calculated the summary statistics for 2014 and 2016 survey data to understand the overall degree of inequality among subgroups at 2 time points.
Microsoft Excel and R (version 3.5.0) were used for all analyses.
RESULTS
Survey respondents
The response rates for the 2014 and 2016 surveys were 19% (n = 1171) and 15% (n = 1823), respectively. Respondents in both years were similar with respect to distribution of gender, neighbourhood income quintile, and self-rated health; however, they differed in age distribution, with a greater proportion of respondents aged 65 and older in 2016 (P = .0007) (Table 1). Overall, performance on all outcome measures improved between 2014 and 2016, with the greatest absolute improvement seen in access after hours (Table 2).
Comparison of survey respondent demographic characteristics in 2014 and 2016
Summary of patient experience measures after stratification by age, gender, neighbourhood income quintile, and self-rated health in 2014 and 2016: Each outcome compares always or often versus sometimes, rarely, or never. Denominators vary for each demographic characteristic owing to variable response rates for each question.
Stratification by demographic characteristic
Patient-centredness seemed to improve with age, and responses from men and women were similar across all outcomes (Table 2). Compared with patients in Q5, those in Q1 consistently reported lower access and patient-centredness, as did those with poor or fair versus excellent self-rated health.
In some cases, these disparities widened between 2014 and 2016. For timely access when sick, patients in Q1 saw no absolute improvement while those in Q5 saw an absolute improvement of 8% (Figure 1). For access after hours, patients with poor or fair self-rated health saw an absolute improvement of 3% while those with excellent self-rated health improved by 24% (Figure 2). In other cases, disparities narrowed. For opportunity to ask questions, patients with poor or fair self-rated health made greater absolute improvements than patients with excellent self-rated health (Figure 2).
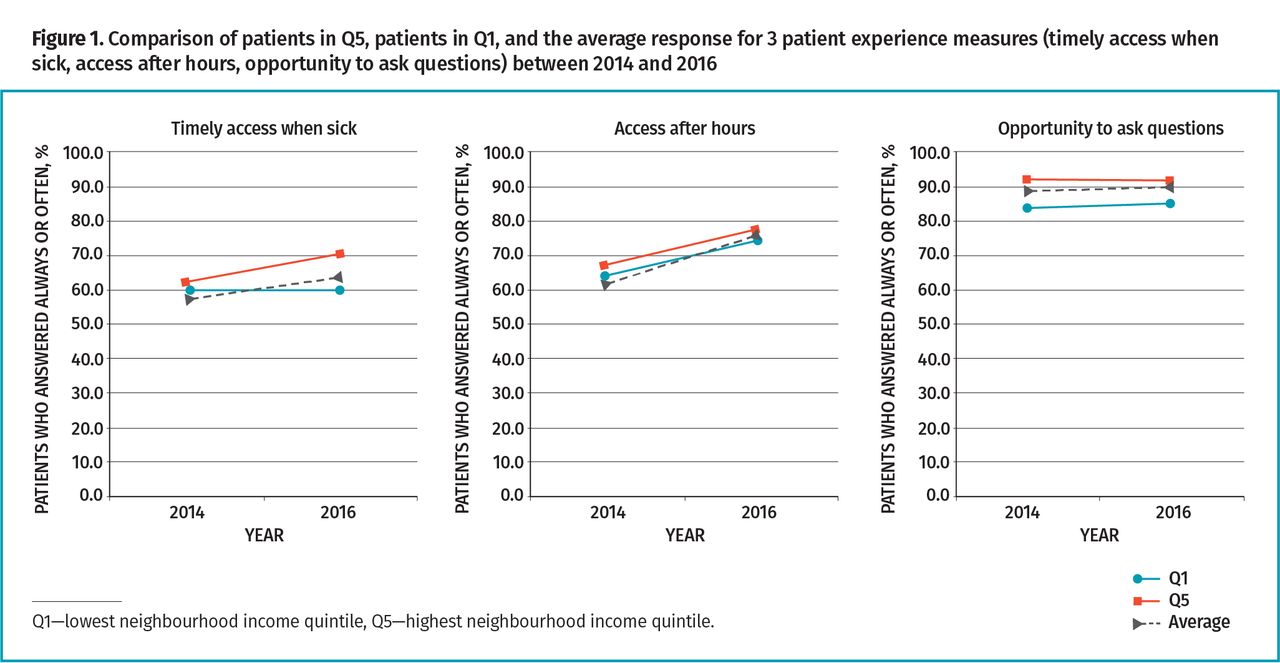
Comparison of patients in Q5, patients in Q1, and the average response for 3 patient experience measures (timely access when sick, access after hours, opportunity to ask questions) between 2014 and 2016

Comparison of patients with poor or fair self-rated health, patients with excellent self-rated health, and the average for 3 patient experience measures (timely access when sick, access after hours, opportunity to ask questions) between 2014 and 2016
Regression analysis
The results of the multiple logistic regression are displayed in Table 3. Patients in Q1 versus Q5 and those with poor or fair versus excellent self-rated health reported significantly less favourable patient experiences before and after adjustment for age and gender (P < .05). The only exception was for after-hours access where there was no significant difference between Q1 and Q5.
Results of logistic regression: Comparison of neighbourhood income quintile and self-rated health subgroups using 2016 survey data. Each outcome compares always or often versus sometimes, rarely, or never. All differences are significant except where indicated.
Bottom-up approach to comparing inequality
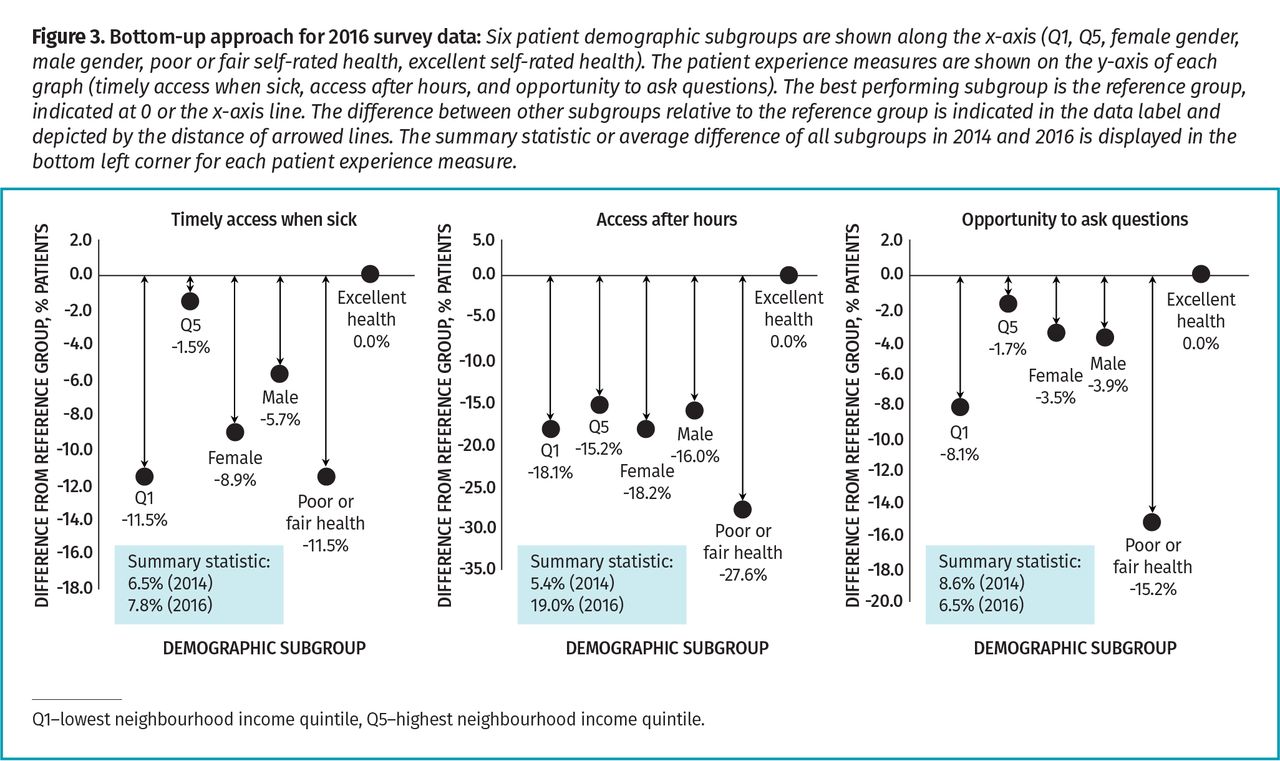
Patients with excellent self-rated health in 2016 consistently rated their experiences the most favourably (Figure 3). Comparing other demographic subgroups to this benchmark, patients with poor or fair self-rated health consistently rated their experiences the least favourably. Comparing summary statistics between 2014 and 2016, the degree of inequality decreased slightly in opportunity to ask questions and increased slightly for timely access when sick. The biggest absolute change was seen in access after hours, where the degree of inequality increased from 5.4% to 19.0%.

Bottom-up approach for 2016 survey data: Six patient demographic subgroups are shown along the x-axis (Q1, Q5, female gender, male gender, poor or fair self-rated health, excellent self-rated health). The patient experience measures are shown on the y-axis of each graph (timely access when sick, access after hours, and opportunity to ask questions). The best performing subgroup is the reference group, indicated at 0 or the x-axis line. The difference between other subgroups relative to the reference group is indicated in the data label and depicted by the distance of arrowed lines. The summary statistic or average difference of all subgroups in 2014 and 2016 is displayed in the bottom left corner for each patient experience measure.
DISCUSSION
In a large, urban family health team engaged in quality improvement, we found that patients living with a lower income and those with poorer self-rated health reported poorer access and patient-centredness, even after adjustment for other sociodemographic variables. Comparing across sociodemographic variables, patients with excellent self-rated health reported the most favourable patient experiences, while those with poor self-rated health reported the least favourable experiences. Between 2014 and 2016, access after hours was the patient experience measure with the greatest overall absolute improvement but also the greatest widening of disparities between the most and least advantaged groups.
Our finding that lower neighbourhood income (as a proxy for socioeconomic status) is associated with poorer patient experience is consistent with previous studies. In the United States, patients in lower income households were found to have lower satisfaction with care,15 while national-level studies in the United Kingdom (UK) have shown that there is a small association between area deprivation or socioeconomic status and patient experience.16-18 Similarly, data from Ontario show that patients with lower household incomes report slightly less timely access when sick and less involvement in care decisions.9 There are no Ontario data on variation by self-rated health but our findings on self-rated health are consistent with national-level research from the UK and United States.18-20
We were surprised that our overall improvements in access after hours were coupled with worsening disparity. We found that patients with excellent self-rated health, who already reported higher access after hours in 2014, reported greater absolute improvement than patients with poorer self-rated health. In 2015, our family health team partnered with patients to develop and implement efforts to improve access after hours. It is possible that the ideas brought forth in consultation with patients reflect a bias toward patients who are more competent in navigating the health care system. As a result, our team’s quality improvement efforts might have been more effective for some patients than others. Patient satisfaction of after-hours care is influenced by care that meets their expectations.21,22 Since our after-hours care cannot guarantee that patients will see their usual physicians, this might deter patients with poorer self-rated health who might value continuity over timeliness. There might be additional barriers that make it challenging for those with poor self-rated health to access care after hours. A study in the UK found that patients of an inner-city primary care clinic who avoided after-hours care often had difficulty finding transportation or arranging care for dependent children and often felt too ill to travel.23 These barriers might contribute to why patients in poorer health are more likely to use the emergency department than those in good health.24
By using different analytic approaches, we were able to understand disparities among our patient population in different ways. Stratification allowed us to easily compare absolute improvements between subgroups over time to see if all patients improved equally. Regression analyses helped us quantify the significance of the disparity for a single sociodemographic variable at 1 time point and understand if these persisted even after adjustment for other factors. The bottom-up approach generated a summary statistic at 1 time point that quantified the overall degree of inequality across multiple sociodemographic variables. Together, these approaches provided a more comprehensive understanding of disparities over time and can help practices prioritize related quality improvement efforts. Studies also suggest that practices consider which quality indicators are most important to patients and how priorities vary by subgroup. For example, research suggests that patients with poor self-rated health value communication and relational continuity whereas younger patients prioritize timely access.25
There are advantages to reporting both unadjusted and adjusted performance measures when evaluating equity in patient experience.26,27 Adjusted outcomes might under-report crucial differences in expectations of care; however, adjusted outcomes might be fairer for population-wide monitoring owing to different sociodemographic distributions.22,27 On a practice level, it is recommended to report unadjusted variations in patient-reported measures.18,22 This is an advantage for many primary care practices where resources for statistical analyses might be limited.
Limitations
There are a number of limitations worth noting. Our survey is in English and is only administered to patients with an e-mail address on file, which influences respondent characteristics.28 Survey response rates were also low. However, it is unclear how noted disparities would change with a different type of survey or response rate. Neighbourhood income quintile is a crude estimate of individual income, especially in a city undergoing gentrification. We also did not examine a number of pertinent sociodemographic variables, including education and immigration, as these questions were not initially included on our survey. Finally, despite a large overall sample size, we had small group sizes for certain patient demographic groups after stratification.
Conclusion
We found that patients with poor self-rated health and patients residing in low-income neighbourhoods consistently reported less timely access and lower patient-centredness in our large urban primary care practice. Our practice made the largest overall improvements in access after hours but these overall improve ments coincided with the greatest widening of disparities. Regular examination of disparities in patient experiences can help practices address health equity by targeting improvement efforts to achieve the same high-quality care for all patients.
Acknowledgment
Dr Kiran is the Fidani Chair of Improvement and Innovation at the University of Toronto. She is supported as a clinician scientist by the Department of Family and Community Medicine at St Michael’s Hospital and at the University of Toronto. She was also supported also supported as an embedded clinician researcher by the Canadian Institutes of Health Research and Health Quality Ontario. This research was funded through Dr Kiran’s Embedded Clinician Researcher award.
Notes
Editor’s key points
▸ Quality improvement efforts might not benefit all subgroups of patients equally.
▸ Patients residing in lower-income neighbourhoods and those with poor self-rated health consistently reported less timely access and reduced patient-centredness of care.
▸ Improvements in after-hours access were associated with worsening of related disparities.
▸ Practices should consider using stratification, regression modeling, or multiple comparisons to understand potential disparities in patient experience.
Points de repère du rédacteur
▸ Les efforts d’amélioration de la qualité pourraient ne pas bénéficier de façon égale à tous les sousgroupes de patients.
▸ Les patients qui résident dans les quartiers à plus faible revenu et ceux qui jugent moins bon leur état de santé ont signalé de manière constante un accès en temps moins opportun et des soins moins axés sur les patients.
▸ Les améliorations sur le plan de l’accès après les heures normales étaient associées à l’aggravation des disparités afférentes.
▸ Les cliniques devraient envisager d’utiliser la stratification, le modèle de régression ou des comparaisons multiples pour comprendre les potentielles disparités dans l’expérience des patients.
Footnotes
Contributors
Dr Kiran conceived of the study. All authors contributed to the design of the study. Dr Zhong and Mr Wang conducted the analysis. Dr Zhong drafted the manuscript. All authors critically revised the manuscript and approved the final version.
Competing interests
None declared
This article has been peer reviewed.
Cet article a fait l’objet d’une révision par des pairs.
↵* The St Michael’s Hospital Academic Family Health Team Patient Experience Survey is available from www.cfp.ca. Go to the full text of the article online and click on the CFPlus tab.
- Copyright © the College of Family Physicians of Canada


