


Abstract
Background: Lack of patient access to family physicians in Canada is a concern. The role of recent physician graduates in this problem of supply of primary care services has not been established. We sought to establish whether career stage or graduation cohort were related to family physician practice volume and continuity of care over time.
Methods: We conducted a retrospective cohort study of family physician practice from 1997/98 to 2017/18. We collected administrative health and physician claims data in British Columbia, Manitoba, Ontario and Nova Scotia. We included all physicians who registered with their respective provincial regulatory colleges as having a medical specialty of family practice or who had billed the provincial health insurance system for patient care as family physicians, or both. We used regression models to isolate the effects of 3-year categories of years in practice (at all career stages), time period and cohort on patient contacts and physician-level continuity of care.
Results: Between 1997/98 and 2017/18, the median number of patient contacts per provider per year fell by between 515 and 1736 contacts in the 4 provinces examined. Median contacts peaked at 27–29 years in practice in all provinces, and median physician-level continuity of care increased until 30 or more years in practice. We found no association between graduation cohort and patient contacts or physician-level continuity of care.
Interpretation: Recent cohorts of family physicians practise similarly to their predecessors in terms of practice volumes and continuity of care. Because family physicians of all career stages showed declining patient contacts, we suggest that system-wide solutions to recent challenges in the accessibility of primary care in Canada are needed.
Access to primary care services in Canada falls short of comparable countries.1 Despite increasing absolute numbers of family physicians, 2 evidence suggests that the volume of patient contacts and practice sizes are in decline,3,4 and that practising family physicians are less likely to provide comprehensive care than in the past.5 This has led to concerns that family physicians’ practice has changed over time, with adverse effects on patients’ access to care.
Some have argued that recently trained physicians think more about work–life balance, are less career motivated and are less likely to engage in comprehensive and continuous family practice.6–10 The implication is that younger family physicians work less and are less likely to be providing accessible, comprehensive care than their older colleagues.11
We sought to measure changes in family physician practice volume and continuity of care between 1997 and 2018 using a method that considers the separate effects on service provision of individual, cohort and contextual factors.
Methods
Study design and setting
We completed a longitudinal study of family physician practice patterns as part of a larger mixed-methods workforce study of early-career family physicians.12,13 This study uses administrative health data for 4 provinces: British Columbia, Manitoba, Ontario and Nova Scotia. We used age–period–cohort modelling, which considers the separate effects on service provision of an individual’s life cycle (age effects); shifts in sociodemographic, economic and political contexts (period effects); and different choices made by groups entering practice at different times (cohort effects). Family physicians in each of the provinces are compensated by provincial health insurance systems. Most Canadian family physicians practise privately and are paid fee-for-service. A smaller proportion are salaried. However, the proportion of physicians in each model of delivery and payment varies across the country.14–16 Family physicians complete undergraduate medical training, followed by a 2-year family medicine residency accredited by the College of Family Physicians of Canada.
Data
We used linked administrative health databases housed in BC (PopDataBC), Ontario (ICES), Manitoba (Manitoba Centre for Health Policy) and Nova Scotia (Health Data Nova Scotia). We accessed comparable databases, developed comparable definitions for all variables and conducted parallel analyses. Databases accessed for this study included registry files from provincial regulatory colleges, physician billing information and patient registration files for provincial insurers. These data sets include information on all physicians registered to practise in their respective provinces, and all patient contacts with these physicians during the study period (see Appendix 1, Table A1, available at www.cmaj.ca/lookup/doi/10.1503/cmaj.220439/tab-related-content). Billing data include fee-for-service billing and shadow billing information in each province.17–20 Shadow billings occur when physicians bill fee codes for tracking purposes, but do not receive full fee-for-service payment. Ontario data sets were linked using encoded identifiers and analyzed at ICES.
Participants
We included all physicians who were registered with their respective provincial regulatory colleges as having a medical specialty of family practice or who billed the provincial health insurance system for patient care as a family physician between the 1997/98 and 2017/18 fiscal years, or both. In any fiscal year we excluded physicians who had fewer than 100 unique patient-day contacts, billed for services delivered on fewer than 50 days during the year, or registered as having another specialty in addition to family practice.
Age, period and cohort
Rather than biological age, we used years in practice as our measure of “age,” which was defined as fiscal year minus graduation year,21 with 2 years excluded from years in practice to account for time in residency. We also allowed the range of years in practice to vary across provinces. Year of graduation was not available in Manitoba, so the analysis relied on the year a family physisican first registered with the provincial insurer. Years in practice in that province were truncated at 23 years, as the first observed year of registration was 1973. We defined “period” as the current fiscal year (from 1997/98 to 2017/18) and “cohort” as the current fiscal year minus years in practice.
Outcomes
Outcomes were the number of annual patient contacts and annual physician-level continuity of care as per physician billing records. Patient contacts represented unique patient–physician–date combinations in physician billings for service delivered in person or virtually. Contacts excluded laboratory services, imaging services and no-charge referrals. We defined physician-level continuity of care as the proportion of total annual contacts (excluding emergency department visits) that all patients seen by a family physician had with that physician.22 For example, if over a fiscal year, a family physician saw 2 patients 2 times each and each patient had 5 family physician visits in total, the continuity measure would equal (2 + 2)/(5 + 5) = 0.4.
Other variables
We tracked physician sex,23 which was self-reported as a binary variable by physicians at the time of college registration, and may represent legal sex, sex assigned at birth or gender. We also tracked practice location (which could change over time).24,25 Practice location was assigned based on the Statistics Canada metropolitan influence zone of residence for patients seen by a family physician.26 The label of “urban” was applied if most contacts occurred in zones 1–3, and “rural” if most contacts occurred in zones 4–7. To describe the family physician cohort and practice patterns, we also captured location of training (Canada, international or unknown),27,28 billing days per year, contacts per billing day, unique patients seen, and the number of physicians with 1 or more shadow billings and 1 or more contacts in ambulatory locations (see Appendix 1, Table A2, for a description of shadow billings).
Statistical analysis
We used an age–period–cohort modelling approach. Keyes and colleagues argued that age–period–cohort modelling requires a core assumption of whether a cohort is defined as a first-order effect that represents the unique conditions that shape lifelong preferences (e.g., the cohort of people born soon after World War II, who had a common set of experiences over their life course), or as the interaction between period and age (e.g., emerging theories of effects of the COVID-19 pandemic on school-age children specifically).29 This choice is conceptual, not empirical.29 We adopted the latter definition, contending that our study cohorts are best defined by nonequivalent period effects on family physicians at different career stages.
We used the median polish approach30 that estimates second-order cohort effects.29 This approach uses a table with the number of rows equal to the number of years in practice categories and the number of columns equal to the number of periods. Each family physician contributed to the measurement of contacts and continuity of care within the years they were observed. These annual measurements were aggregated into equal 3-year categories of years in practice and period, which made up the rows and columns of the table. In the cells of the table, we estimated the corresponding median of the measurements for contacts or continuity of care. We used the median because the distributions of these outcomes were right skewed. Thus, each cell of the table contained the observed median for the corresponding years in practice–period combination (e.g., years in practice = 3–5 yr, period = FY2000 to FY2002). We regressed the medians on indicators for years in practice and period. Then we used median polish to iteratively subtract row and column medians from the cell values, until the row and column medians approached 0. The residuals that remained in the cells were then regressed on cohort indicators. We estimated the regression coefficients using a linear model. We generated bootstrap standard errors with 1000 iterations for all regression coefficients using the cells of the years in practice by calendar–period table. We plotted the coefficient estimates and confidence intervals. Because all independent variables were categorical, we chose a reference category for period (FY1997 to FY1999), years in practice (0–2 yr) and cohort (FY1991 to FY1993). The plots show a horizontal solid line at 0, which indicates no difference from the reference category. The plots for the main effects are provided in the following section, while stratified analyses for sex and rural or urban practice are provided in Appendix 1, Figures A1–A12.
Ethics approval
This project received ethics approval from the University of British Columbia–Simon Fraser University Harmonized Behavioural Research Ethics Board (Ethics No. H18-03291), Ontario Tech University Ethics Board (Ethics No. 14867), Nova Scotia Health Authority Ethics Board (Ethics No. 1023561) and the University of Manitoba Ethics Board (Ethics No. HS23897 [H2020:208]).
Results
Table 1 shows descriptive statistics for included family physicians in all provinces at the beginning and end of the study period: fiscal years 1997/98 and 2017/18. Mean contacts billed by family physicians declined in each province between the start and end of the study period, as did reported contacts per billing day and unique patients whom the physician reported having seen. The proportion of family physicians using shadow billing increased in all provinces concurrently with the increase in the proportion of physicians compensated via alternative payment models.16 Physician-level continuity of care, as indicated by physicians’ billing records, remained stable. Plots of the trends of contacts and continuity of care and counts of family physicians contributing to these trends (and to the analysis below) are provided in Appendix 1, Figures A13–A16. The complete number of family physician observations in each time period and province are described in Appendix 1, Table A3. Full details on family physician years in practice are provided in Appendix 1, Table A4. As a sensitivity analysis, we also generated our results using mean contacts and continuity of care, but this did not materially change our findings (see Appendix 1, Tables A7 and A8).
Family physician characteristics, 1997/98 and 2017/18
Period
Figure 1 shows the effects of period on patient contacts. Relative to the earliest period (FY1997 to FY1999), the median number of billed contacts declined over the study period. Although the pattern of decline was consistent in all provinces, it was significant only in Manitoba. The decline was more pronounced in rural practices (see Appendix 1, Figure A7).

Period effects on median patient contacts, with 95% confidence intervals.
Figure 2 shows the effects of period on median physician-level continuity of care, which remained stable over the study period. We did not observe clear differences when the data were stratified by family physician sex or into rural and urban practice (Appendix 1, Figures A4 and A10).

Period effects on median physician-level continuity, with 95% confidence intervals.
Years in practice
Figure 3 shows the effects of years in practice on median patient contacts in the 4 provinces. In all provinces, inverted-U-shaped curves show median contacts peaking at 27–29 years in practice (between 2340 and 2566 more contacts at the median than at 0–2 years in practice). In Manitoba, where the data were truncated, we saw the beginnings of the same trend — physicians 21–23 years in practice had 3063 (95% confidence interval [CI] 1670 to 4457) more contacts at the median than physicians in their first 3 years. The peaks of this trend were slightly higher for male physicians. Although the median contacts of physicians at the start and end of their careers were not statistically significantly different in BC, they were substantially lower at the end of their careers. Family physicians in Ontario reached a minimum at 54–56 years in practice (−1864; 95% CI −3702 to −26).
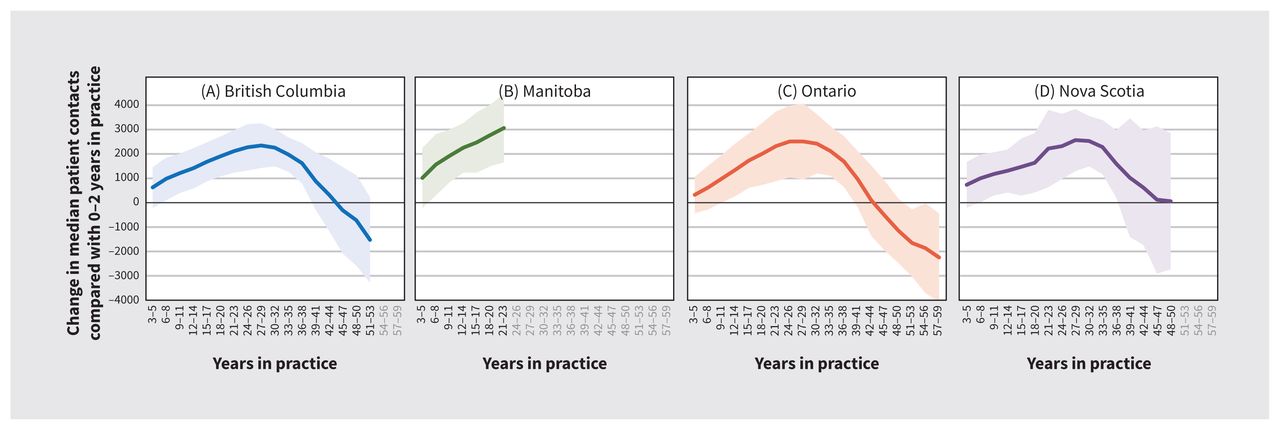
Years in practice effects on median patient contacts, with 95% confidence intervals.
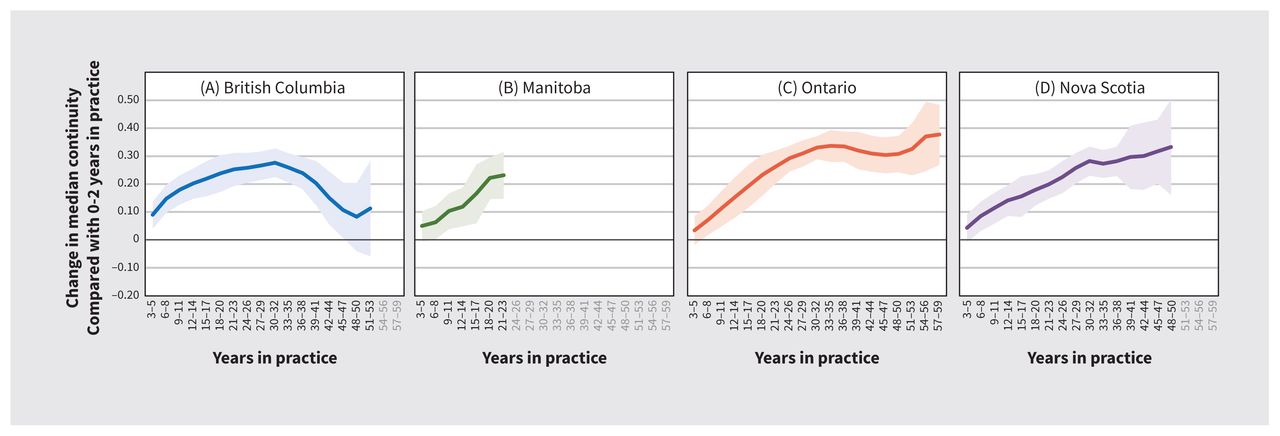
Figure 4 shows the effects of years in practice on physician-level continuity of care. Median continuity increased consistently until 33–35 years in practice in Ontario (0.336; 95% CI 0.279 to 0.393), 30–32 years in Nova Scotia (0.282; 95% CI 0.230 to 0.334) and at 30–32 years in practice (0.276; 95% CI 0.226 to 0.327) in BC. In BC, continuity of care subsequently declined to levels that were not significantly different from those at 0–2 years in practice.

Years in practice effects on median physician-level continuity, with 95% confidence intervals.
Cohort
Figure 5 shows the effects of cohort on patient contacts in the 4 provinces. The effects are generated from the model of the residuals from the median polish analysis (second-order cohort effects). We observed no difference in billed patient contacts per year across cohorts, with the exceptions of the extremes of the cohort distribution. Family physicians who started practice in the late 1940s and early 1950s had lower median patient contacts than those who started practice in 1991–93 in all 3 provinces in which data were available (Manitoba data were not available for the older cohorts). In BC, Ontario and Nova Scotia, family physicians who started practice in the mid to late 2010s had higher median patient contacts than those who started practice in 1991–93.

Cohort effects on median patient contacts, with 95% confidence interval. Note: Vertical dotted line indicates comparator cohort year.
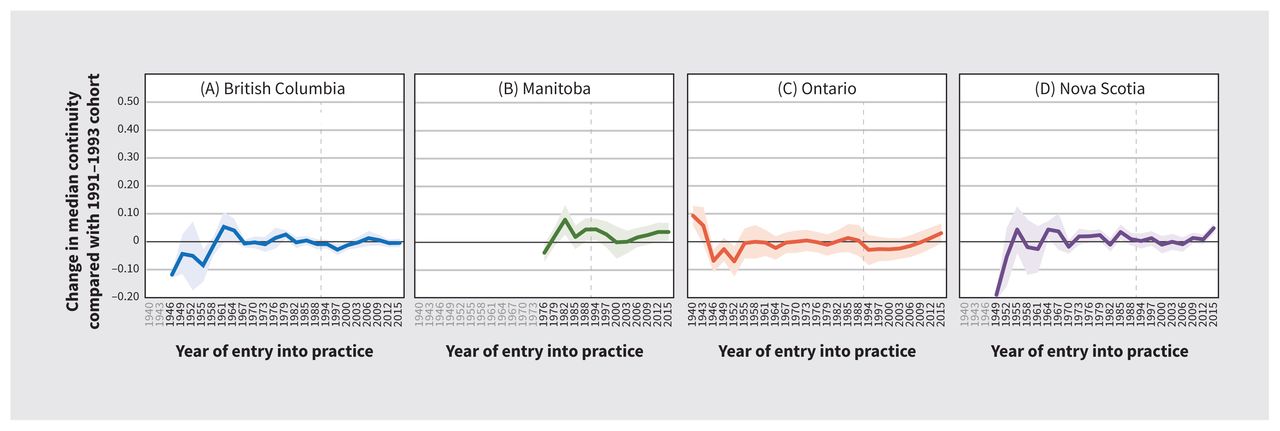
Figure 6 shows the effects of cohort on physician-level continuity of care in the 4 provinces. Continuity of care was higher for family physicians in Ontario in practice since the 1940s than for those who started practice after 1955. Stratified analysis in that province showed a small number of senior urban family physicians providing very high continuity of care (Appendix 1, Figure A12).

Cohort effects on median physician-level continuity, with 95% confidence intervals. Note: Vertical dotted line indicates comparator cohort year.
Interpretation
Median family physician contacts decreased between 1997 and 2018 in British Columbia, Ontario, Nova Scotia and Manitoba. Median contacts increased with physician years in practice until mid-to-late career and declined toward the end of physicians’ careers. These findings align with our expectations and with earlier research.3,4,31 Similar to contacts, continuity of care increased with years in practice and fell in the later stages of a career in BC, but not in Ontario or Nova Scotia. We found that patient contacts and continuity of care were not affected by the cohort that a family physician belonged to. We did not observe declines in contacts or continuity of care in millennial-generation family physicians (i.e., those entering practice after 2008) relative to previous cohorts. We observed changes in family physician practice over time across physicians at all career stages, not just in those entering practice in recent years.
In previous studies that used physician survey data, Watson and colleagues found that younger family physicians had smaller workloads in 2003 than their peers did 10 years earlier, perhaps suggesting the existence of a cohort effect.4 Using similar data but different methods, Crossley and colleagues and Sarma and colleagues found no evidence of cohort effects;21,32 we found similar results using a different measure and applying different empirical methods.21,32
Whether declines in patient contacts reflect an increase in patient complexity, an increase in administrative burden, increased quality, changes in education or professional norms, different choices about work, or different income requirements is not clear; however, observed declines are not unique to current early-career physicians. Although further work is needed to parse out the causal mechanisms for declines in service volume, our findings point to a need for robust workforce planning that incorporates the physician age distribution and secular trends in service volume, in addition to changing patient demographics, which have been included.33–35 Because practice patterns differ over the course of physicians’ careers, the age distribution of the physician workforce should be part of any health workforce planning model. Our findings suggest that a physician workforce with more physicians at the extremes of the distribution will bill for lower quantities of service than a distribution with most physicians in mid career.36 The decline in reported contacts across all physician cohorts in each province indicates that even with increasing per-capita supply of family physicians, additional resources will be needed to maintain or improve access to primary care. Because patient contacts have decreased for family physicians of all career stages, physician-specific solutions to recent declines in service quantity will need to be broadly targeted to all family physicians, rather than a specific cohort. As continuity of care appears lowest in early career, interventions to increase continuity may have more success if they target early-career family physicians. This may include expanded opportunities to join team-based models that deliver longitudinal care but do not require physicians to independently build and manage a patient panel.37
Limitations
We used billing data that did not fully capture the scope or complexity of the services provided. We did not observe the types of services received, the complexity of the patient population seen, or work not captured by service volume. Observed patient contacts may have been affected by increases in alternative payment plans and shadow billing over the study period in all physician cohorts. These may, at least in part, account for observed declines in patient contacts but are unlikely to have “masked” any reductions in service volume in recent graduates. Further, the similarity in the observed effects across provinces despite substantial differences in uptake of alternative payment plans among them suggests that the influence of shifting to such plans on these relationships is likely small. We defined “cohort” as an interaction between period and years in practice, which facilitated robust estimation of this effect as a nonadditive combination of these factors. Our results are consistent with previous studies that relied on an alternative definition of “cohort,”32 but future analyses of longitudinal administrative data of physician practice could determine whether different definitions produce different results.
Conclusion
This study showed declines in service volume according to physician billings in 4 Canadian provinces, with expected trajectories of service volume and continuity of care over a family physician’s career but no generational differences in family physician practice. These findings are important for health workforce planning in primary care sectors across the country and suggest that any intergenerational tension and blame is unfounded and may distract from more important issues in workforce planning in primary care sectors.
Footnotes
Competing interests: David Rudoler reports receiving funding from the Canadian Institutes for Health Research (CIHR) for this research, and support from CIHR to attend scientific meetings where the results of this research were presented. Alan Katz reports receiving grants from CIHR, the Canadian Foundation for Innovation and Indigenous Health Research, as well as a Catalyst Grant in support of the present research (all funds held by institution). Dr. Katz is also the president of the Canadian Association for Health Services and Policy Research. Emily Marshall reports receiving CIHR grant funding in support of the present manuscript. Sabrina Wong reports receiving CIHR grant funding in support of the present manuscript. Fred Burge reports receiving CIHR grant funding in support of the present manuscript. Richard Glazier reports receiving CIHR grant funding in support of the present manuscript, paid to the principal investigator’s institution. Adrian MacKenzie reports being a current employee of Nova Scotia Health and former employee of Government of Nova Scotia. Dr. Mackenzie has also received travel support from Pan American Health Organization, and has served on the boards of Canadian Association for Health Services and Policy Research and Justice Emmett Hall Foundation since 2021. Rita McCracken and Ian Scott are employed by the University of British Columbia. No other competing interests were declared.
This article has been peer reviewed.
Contributors: Doug Blackie, Fred Burge, Rick Glazier, Laurie Goldsmith, Agnes Grudniewicz, Lindsay Hedden, Alan Katz, Margaret Jamieson, Ruth Lavergne, Adrian MacKenzie, Emily Marshall, Rita McCracken, Kim McGrail, David Rudoler, Ian Scott and Sabrina Wong contributed to the conception and design of the work. Ruth Lavergne, Sandra Peterson, David Rudoler, David Stock, Carole Taylor and Drew Wilton contributed to the acquisition, analysis and interpretation of data. David Rudoler and Ruth Lavergne drafted the manuscript. All of the authors revised it critically for important intellectual content, gave final approval of the version to be published and agreed to be accountable for all aspects of the work.
Funding: British Columbia: Data for this project were accessed through Population Data BC, PopData Project No. 19-044. All inferences, opinions, and conclusions drawn in this article are those of the authors, and do not reflect the opinions or policies of the data steward(s) or the organizations (e.g., the US National Institutes of Health, Department of Health and Human Services or the US Government) where the authors are currently located. Ontario: This study was supported by ICES, which is funded by an annual grant from the Ontario Ministry of Health (MOH) and the Ministry of Long-Term Care (MLTC). Parts of this material are based on data and information compiled and provided by MOH and the Canadian Institute for Health Information (CIHI). The analyses, conclusions, opinions and statements expressed herein are solely those of the authors and do not reflect those of the funding or data sources; no endorsement is intended or should be inferred. Nova Scotia: The data (or portions of the data) used in this report were made available by Health Data Nova Scotia of Dalhousie University (No. 2017-EGM-001). Although this research/health service assessment analysis is based on data obtained from the Nova Scotia Department of Health and Wellness, the observations and opinions expressed are those of the authors and do not represent those of either Health Data Nova Scotia or the Department of Health and Wellness. Manitoba: The authors acknowledge the Manitoba Centre for Health Policy for use of data contained in the Manitoba Population Research Data Repository under project No. 2020-026 (HIPC No. 2020/2021-10). The results and conclusions are those of the authors and no official endorsement by the Manitoba Centre for Health Policy, Manitoba Health, or other data providers is intended or should be inferred. Data used in this study are from the Manitoba Population Research Data Repository housed at the Manitoba Centre for Health Policy, University of Manitoba and were derived from data provided by Manitoba Health. This study also received funding from the Canadian Institutes of Health Research (CIHR-Project Grant 155965).
Data sharing: The data that support the findings of this study are approved for use by data stewards and accessed through a process managed by each province’s data centre. Requests to access the data sets used for this study can be made to PopData (https://www.popdata.bc.ca/data_access), ICES (www.ices.on.ca/DAS; email: das{at}ices.on.ca), Manitoba Centre for Health Policy (www.umanitoba.ca/manitoba-centre-for-health-policy/), and Health Data Nova Scotia (https://medicine.dal.ca/departments/department-sites/community-health/research/hdns.html). We are not permitted to share the data used in this analysis with other researchers. The full data set creation plan and underlying analytic code are available from the authors upon request, understanding that the computer programs may rely upon coding templates or macros that are unique to this project and to individual data centres and are therefore either inaccessible or may require modification.
- Accepted October 20, 2022.
This is an Open Access article distributed in accordance with the terms of the Creative Commons Attribution (CC BY-NC-ND 4.0) licence, which permits use, distribution and reproduction in any medium, provided that the original publication is properly cited, the use is noncommercial (i.e., research or educational use), and no modifications or adaptations are made. See: https://creativecommons.org/licenses/by-nc-nd/4.0/
References
In this issue

Article extras
Article tools


Jump to section
Related Articles
Cited By...
- Characteristics of Walk-In Clinic Physicians and Patients in Ontario, Canada: A Cross-Sectional Study
- Understanding and addressing changing administrative workload in primary care in Canada: protocol for a mixed-method study
- Starting out rural: a qualitative study of the experiences of family physician graduates transitioning to practice in rural Ontario
- Ending the generational blame game: Let us move forward with needed primary care change
- Mettre fin au jeu du blame generationnel: Entamons les changements necessaires en soins primaires
- Garder la porte dentree ouverte : assurer lacces aux soins primaires a toute la population canadienne
- Our role in making the Canadian health care system one of the worlds best: How family medicine and primary care can transform--and bring the rest of the system with us
- Notre contribution a levolution du systeme de sante canadien pour en faire lun des meilleurs au monde: Comment la medecine de famille et les soins primaires peuvent-ils faire evoluer le systeme dans son ensemble?
- Keeping the front door open: ensuring access to primary care for all in Canada
More in this TOC Section
Similar Articles
Collections

