Article Text

Abstract
Background: Cardiovascular disease (CVD) prevention guidelines typically dichotomise patients by history of CVD, as patients with prior CVD are assumed to be at high CVD risk, whatever their CVD risk profiles.
Objective: To assess the appropriateness of this practice by comparing CVD event rates of patients with and without prior CVD, over and above risk predicted by standard CVD risk factors.
Methods: Between 2002 and 2007 CVD risk assessments were generated using a web-based Framingham risk prediction algorithm in routine primary care. Individual risk profiles were subsequently linked to national hospitalisation and death records. Observed and predicted (Framingham) CVD risk were compared in patients with and without prior CVD.
Results: 35 760 patients were assessed including 10.4% with prior CVD. Of 1216 first CVD events during an average follow-up of 2.05 years, 42% occurred in those with prior CVD. Among those without prior CVD, the predicted Framingham five-year CVD risk was similar to the observed risk extrapolated to five years; in the highest Framingham risk band (>20% five-year risk), observed risk was 25.3%. Among those with prior CVD the observed risk extrapolated to five years rose from 21.7% in the lowest Framingham risk band (<5%) to 49% in the highest (>20%).
Conclusions: Patients with prior CVD have five-year CVD risks approximately 20% higher, in absolute terms than patients without prior CVD, after accounting for standard risk factors. Almost half the CVD events occurred in those with prior CVD. These patients should be the highest priority for intensive preventive management in primary care.
Statistics from Altmetric.com
In New Zealand and internationally the intensity of cardiovascular disease (CVD) risk factor management is driven by the absolute CVD risk.1 In most studies patients are dichotomised according to whether or not they have had a prior CVD event. Currently, patients without known CVD (primary prevention group) are risk stratified using one of a number of validated primary prevention equations that include the Framingham equation and, more recently, SCORE, ASSIGN and QRISK.2–5 Patients with prior CVD (secondary prevention group) are not included in the primary prevention cohorts used to derive these risk equations. While there have been equations derived to assess CVD risk for stable CVD in secondary prevention,6 in practice, those patients with a prior CVD event are usually considered at “clinically high risk” without any further risk stratification.7 8 This risk allocation was based on clinical trial data in secondary prevention populations reporting five-year CVD event rates in excess of 20%.9 10
Although the underlying atherosclerotic pathophysiological process is a continuum from mild to severe disease this dichotomisation of risk assessment between primary and secondary prevention populations leads to a tendency to consider the two groups separately in both epidemiological analyses and in clinical practice. A better understanding of the risk of CVD across the spectrum of primary and secondary prevention and a unified approach to risk prediction are desirable.
In the Auckland region of New Zealand, PREDICT, a web-based clinical decision support programme providing CVD risk assessment and management advice to patients with and without prior CVD seen in primary care has been implemented over the past five years. The programme has generated comprehensive, systematically and uniformly collected individual patient CVD risk data on large numbers of patients. In New Zealand it is also easy to electronically link patient-specific data to national hospital discharge data and death registrations using a unique national health identifier. This has provided an opportunity to study the continuum of CVD risk in a large community cohort.
The aim of this study was to assess the appropriateness of considering patients with prior CVD at high risk, by comparing the risk of primary care patients with and without prior CVD after adjusting for standard CVD risk factors.
PATIENTS AND METHODS
CVD risk factor data collection: PREDICT
PREDICT-CVD, a web-based clincial decision support program, has been implemented as an opportunistic CVD risk assessment and management program in primary care in Auckland, New Zealand since 2002. Criteria for risk assessment were dervied from nationally agreed guidelines.8 Implementation was initially in two large Auckland primary care organisations, ProCare and HealthWest, serving approximately 470 000 patients over 35 years. A description of the first 18 000 patients assessed has been reported.11 PREDICT has been integrated with the most commonly used practice management system software. The program is delivered as a window within an electronic patient medical record in the same manner as other templates within the patient management system (PMS). The integration allows CVD risk data to be automatically extracted from a patient’s electronic medical record and copied into the PREDICT web template. Other data not available in the medical record are entered directly by the general practitioner or practice nurse during the consultation. The risk profiles generated are automatically sent via a secure internet connection to a central server. Only completed risk factor templates are accepted by the system. Within seconds the clinician receives the patient’s calculated five-year Framingham derived CVD risk as well as evidence-based risk-management recommendations derived from New Zealand CVD guidelines. Whenever PREDICT is used, an electronic CVD risk factor profile is stored anonymously for each patient.
Data and definitions
Data collection commenced in August 2002. The data extract for these analyses included all first assessments until July 2007. Detailed data definitions have been published previously.11 Demographic data collected within PREDICT include age, gender, ethnicity and the National Health Information Index (NHI). History of CVD was defined as a personal history of ischaemic heart disease (IHD), stroke or transient ischaemic attack (TIA), peripheral vascular disease (PVD), percutaneous coronary intervention (PCI) and/or coronary artery bypass graft (CABG). CVD risk factor items included diagnosis of diabetes, smoking status (smoker, non-smoker, or past smoker who quit more than 12 months ago), systolic and diastolic blood pressure (mm Hg) and total cholesterol:HDL (high-density lipoprotein) ratio.
Outcome assessment
Linkage
The New Zealand Information Service (NZHIS) databases collect public hospital discharge data and death certification data for the New Zealand population. The PREDICT and NZHIS databases were linked using the NHI, a unique identifier held by each patient within the health sector in New Zealand. The NHI number was encrypted to ensure patient confidentiality. Outcomes data were extracted from the NZHIS databases of deaths and public hospital discharges for all patients with a baseline PREDICT-CVD record. First CVD events occurring after the baseline PREDICT record are used in these analyses. Events occurring since entry to PREDICT were classified as being ischaemic cardiovascular events if a hospital discharge included the international statistical classification of diseases, 10th revision ( ICD-10)12 codes for a diagnosis of acute coronary syndrome, ischaemic and haemorrhagic stroke, or peripheral arterial disease, a procedure for these conditions (for example, percutaneous coronary intervention or coronary artery bypass grafting) and congestive heart failure. Deaths registered in 2002 or 2004 were accepted as ischaemic CVD if the underlying cause of death was from the same range or from sudden death ascribed to acute myocardial infarction. For deaths registered during 2005 to 2007, causes of death were available in text but not in coded form, so CVD events were independently identified by two of the authors (SW and TR) with discrepancies agreed by consensus. Unfortunately, even text information for cause of recent deaths during 2007 was not available so deaths registered during this period could not be considered for inclusion as outcomes. The full list of ICD codes used are available from the authors on request.
CVD risk assessment
Individual patient CVD risk factor profiles from the PREDICT-CVD database were used to calculate Framingham CVD risk prediction scores for each patient using an equation published by Anderson et al.2 CVD risk factor items entered into this equation were age, gender, diagnosis of diabetes, smoking status (non-smokers were defined as those who stopped over one year ago or lifelong non-smokers), systolic and diastolic blood pressure (mm Hg) and total cholesterol:HDL ratio. The equation was designed to be used for people without prior CVD and classified patients by five-year risk of a CVD event: <5%, <10%, 10–<15%, 15–<20%, ⩾20%. To facilitate the comparison between primary and secondary prevention groups, after adjusting for CVD risk factors, the same Framingham CVD equation was used to estimate risk for patients with prior CVD. Patients between the ages of 30 and 74 years at the time of their baseline PREDICT assessment were included.
To enable more meaningful comparisons between Framingham risk prediction scores and observed event rates, the observed event rates were extrapolated to five-year cumulative event rates.
All analyses were conducted in SAS Version 9.1. Annual incidence rates, I, in each of the Framingham risk groups were obtained by dividing the number of cases by the person-time of follow-up. Five-year cumulative incidence was estimated, assuming constant incidence, by 1−exp(−5I).
The PREDICT study was approved by New Zealand Northern X ethics committee (AKY/03/12/314), the multi-region ethics committee (MEC/07/19/EXP), and by ProCare and HealthWest Primary Health Care Organisations.
RESULTS
A total of 35 760 patients in the PREDICT dataset were linked to hospitalisation and death records. All patients had complete risk factor profiles with no missing values. There were 3728 (10.4%) patients with prior CVD and 32 032 patients without prior CVD. Patients with prior CVD were older, slightly more likely to be men, more likely to be current smokers and to have diabetes (table 1). For those with prior CVD, 71.8% had a history of ischaemic heart disease, 24.2% had ischaemic strokes and 13.7% reported PVD. Some patients had more than one type of prior CVD event. The subjects in this study represent approximately 8% of the total population over 35 years in the primary healthcare organisations in which PREDICT has been implemented.
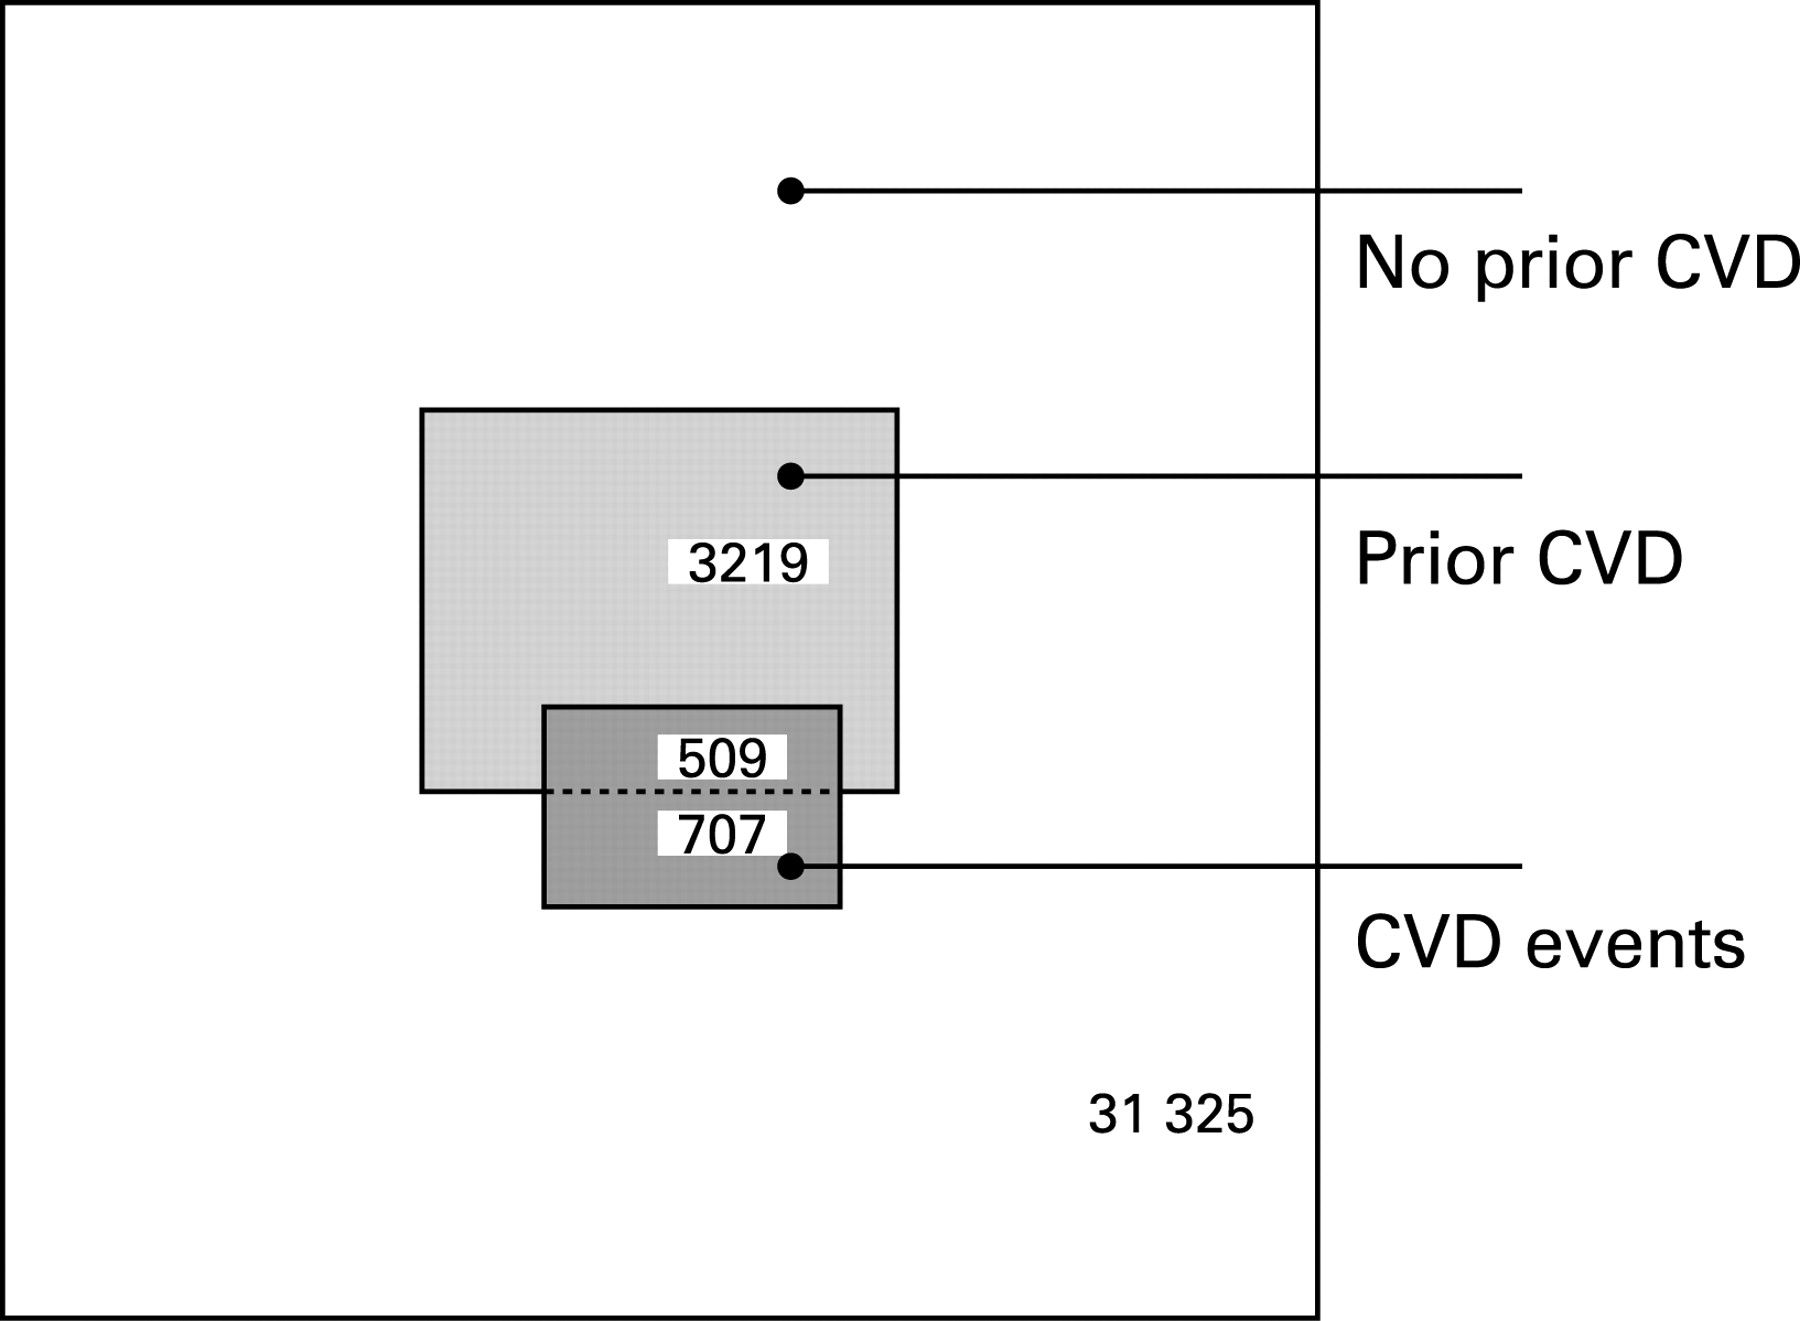
There were 73 411 person-years of follow-up with a mean of 2.053 years per person (range 0.04–4.97 years) (table 2). Of the 1216 patients with at least one CVD event during the follow-up period, 509 (42%) occurred among those with prior CVD, and 707 (58%) in those without prior CVD. Over half of the total first events in each group were IHD related.
Among patients without prior CVD there was a linear increase in observed risk (extrapolated to five-year CVD event rates) across the Framingham predicted five-year risk groups with reasonably good agreement between predicted and observed outcomes (fig 1). However the predicted risk consistently overestimated observed risk and the degree of overestimation increased as predicted risk increased. Similarly, for patients with prior CVD, the observed risk increased linearly in association with the predicted Framingham risk, although the slope of the line was slightly steeper and the observed risk was equivalent to the predicted risk plus about 20%. For the lowest predicted risk category (<5% five-year risk), the observed five-year risk in patients with prior CVD was 21.7%, similar to the observed risk for those in the highest (>20%) risk group without prior CVD. The observed five-year event rate was 49% among patients with prior CVD in the highest (>20%) predicted risk category. The mean five-year CVD event rates were 28.6% and 5.2% for those with and without prior CVD, respectively.

Those with prior CVD made up only 10.4% of the population but contributed 42% of the total events (fig 2).

DISCUSSION
Understanding the population distribution of CVD risk is important for individual patient management and for designing treatment programmes to effectively and efficiently reduce future cardiac morbidity and mortality. We have shown in a large primary care-based cohort aged from 30 years to <75 years that about 40% of CVD events occurred in the 10% of patients with prior CVD. Among those with prior CVD the mean five-year CVD risk was 28.6% compared to 5.2% in those without prior CVD, and when stratified by a Framingham CVD equation the five-year risk ranged from about 20% in the lowest risk group to about 50% in the highest risk group. Moreover the lowest risk group with prior CVD had a similar risk to the highest risk group of patients without prior CVD. Given that patients at highest absolute risk stand to gain the most from CVD risk management, these findings provide strong support for aggressive management of patients with prior CVD as a high priority in primary care.
Risk stratification for those with and without prior CVD
There is currently no single prediction equation available for stratifying total CVD risk across a population. In our analysis we applied a Framingham CVD equation developed to predict CVD risk in primary prevention to our secondary prevention population to estimate the impact of a prior CVD event on future risk after accounting for the standard CVD risk factors. We demonstrate that this Framingham equation stratified risk equally well in patients with and without prior CVD but that the presence of prior CVD confers an additional approximate 20% five-year risk over and above the observed risk in those without CVD.
Clinical implications
Traditionally the main focus of CVD risk stratification has been on quantitative risk estimation in those without prior CVD, with allocation of those with prior CVD to an undifferentiated “clinically high risk” category. This study confirms that it is appropriate to consider those with prior CVD to have a risk, which is at least as high as the high-risk primary prevention population. However, there may be advantages for patient management and population health planning in stratifying risk across the spectrum of primary and secondary prevention using a common tool predicting short-term (for example, five-year) CVD risk. Practitioners should be reminded that when patients have had a CVD event, even those with apparently reasonable risk factor profiles are at significant risk of further events and should be treated aggressively. This risk appears similar to that of the highest risk groups without prior CVD. Patients may also find it useful and motivating to know their numerical risk and to track its improvement with improved secondary prevention, rather than always being labelled as “clinically high risk”. In our experience this is often quite demoralising for patients.
Guidelines appropriately recommend that “clinically high-risk” patients all receive optimal aggressive intervention. In practice, however, we know that there are significant treatment gaps in secondary prevention and not all patients receive these interventions for a variety of social and economic reasons.13–15 In the face of limited resources use of risk stratification tools in secondary prevention may be appropriate to rationally target more intensive prevention programmes in those at highest risk.
Limitations
We have not sought to produce a unified equation to estimate risk across the spectrum of primary and secondary disease. Rather, our aim is to show in a simple analysis how this may be an achievable and useful approach. While the stratification of CVD risk we have performed using the Framingham equation in prior CVD facilitates understanding of CVD risk at a population level we do not recommend its use for individual patients. Our cohort is currently too small with insufficient follow-up time to generate an accurate risk prediction equation. It is possible that future event rates may be influenced by the subtype of the prior CVD event in which case subgroup specific adjustments to the prediction equations may be necessary—for example, for stroke vs IHD. Once again, the numbers in the current cohort are insufficient to make this assessment. However, the cohort is growing as new participants continue to be added as part of routine primary care risk assessment and management using our web-based risk prediction and management tool. Moreover as we are able to undertake record linkage cheaply and efficiently, we will be able to develop new unified primary/secondary care risk prediction algorithms with 1–2 years. Our current dataset does not include treatment data although most drug prescriptions in New Zealand are now linkable using the same national identifier we use for linking hospitalisations and deaths. By using a one-way encryption procedure, we are able to undertake all linkage anonymously and our processes have passed rigorous confidentiality requirements.
The cohort studied is an opportunistically enrolled primary care sample that meets New Zealand Guideline recommendations for CVD risk assessment. It is therefore likely to be representative of the population presenting for CVD risk screening but not necessarily of the population as a whole. However the main requirement of risk prediction studies is that they include a heterogeneous population covering the range of patients at risk rather than a representative sample of patients. This requirement is met with estimated CVD risks ranging from less than 1% in five years to approximately 50%. Of note, the risk profiles of participants in this study are similar to those in a representative sample of the same population,16 suggesting that the participants are reasonably representative of the population eligible for risk assessment.
In conclusion, patients with a prior CVD event have a five-year CVD risk approximately 20% higher, in absolute terms, than patients with no prior CVD, after accounting for the standard CVD risk factors. Moreover almost half of the CVD events occurring in this contemporary primary care cohort were from the minority of patients with prior CVD. Given the well documented effectiveness of secondary prevention, these findings provide convincing evidence that patients with a history of CVD should be a high priority for CVD prevention strategies in primary care. Stratification of CVD risk using algorithms that represent patients with and without CVD events on common axes may facilitate rational health planning and clinical decision-making.
Acknowledgments
We thank Roger Marshall and Mildred Lee for their expert statistical assistance. The authors would like to thank Procare PHO and HealthWEST PHO staff and their patients. PREDICT-CVD was developed by a collaboration of clinical epidemiologists at the University of Auckland, IT specialists at Enigma Publishing Ltd (a private provider of online health knowledge systems) and group of clinicians and support staff from Middlemore Hospital, Counties Manukau District Health Board, ProCare Health Ltd, National Heart Foundation, New Zealand Guidelines Group and the Ministry of Health. The PREDICT software platform is owned by Enigma Publishing Ltd (PREDICT is a trademark of Enigma Publishing Ltd).
REFERENCES
Footnotes
-
Funding: The PREDICT research project is supported by a grant HRC 03/183 from the Health Research Council. The researchers are independent of the funding body. SW was the recipient of a National Heart Foundation research fellowship (2003-06).
-
Competing interests: None.
-
Ethics approval: The PREDICT study was approved by the New Zealand Northern X Ethics Committee (AKY/03/12/314) and by the Multi-Region ethics committee MEC/07/19/EXP.
-
Contributors: All authors contributed to the study design, data collection, analysis, interpretation and manuscript preparation. AK acts as guarantor for the paper.